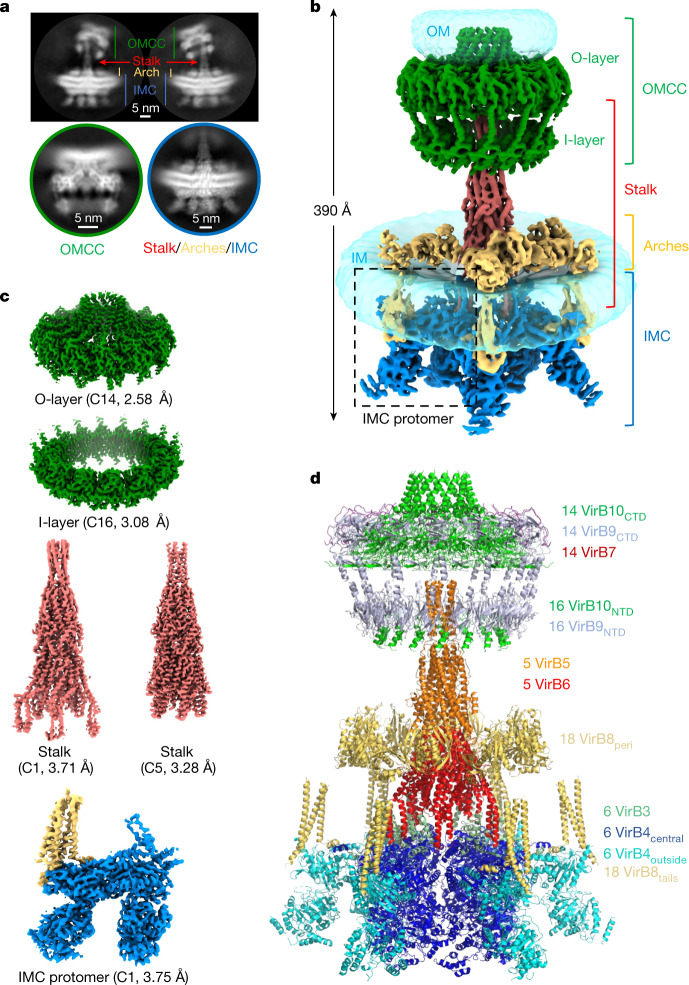
Fig. 1. Overall structure of the R388 conjugative T4SS.
a, Representative 2D class averages of the T4SS obtained using cryoSPARC. Top, two 2D class averages of the entire T4SS demonstrate substantial flexibility of the OMCC relative to the stalk and the IMC. As a result, particles were subsequently centred on the OMCC (bottom left) or on the IMC–stalk (bottom right) and processed separately. b, Composite electron density map of the R388 T4SS. This map results from the assembly of two C1 maps, that of the OMCC (OMCC C1 3.28 Å map) and that of the IMC, arches and stalk (IMC–arches–stalk C1 6.18 Å map). The OMCC, stalk, arches and IMC are shown in green, red, yellow and dark blue, respectively, except for the VirB8tails that are part of the IMC, which are shown in yellow. The various regions are labelled accordingly. σ levels for these maps are as in Extended Data Fig. 3b,f. For the detergent and/or lipid densities (in transparent light blue) at the membrane and outer membranes, the maps are shown at increased contour levels of 0.03 and 0.15, respectively, and smoothed using a Gaussian filter. c, Near-atomic resolution maps used in this study. Each map is labelled and contoured as in Extended Data Fig. 3. The resolution of the map is indicated. d, Overall composite model of the R388 T4SS. Each protein is in ribbon representation.

