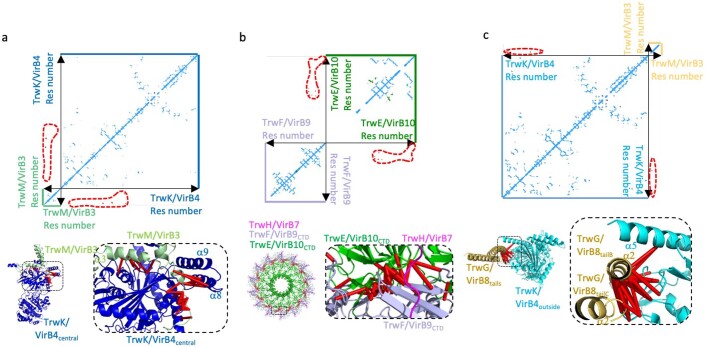
Extended Data Fig. 9. Validation of the T4SS heterologous interfaces using the co-evolution method as implemented by TrROSETTA.
For each panel, three sub-panels are shown. Upper panel: plots of pairwise TrROSETTA contact probability score. Each dot represents a pair of co-evolving residues with TrROSETTA score larger than a case-specific threshold (see Methods). Dots are coloured blue, green, or red (also surrounded by a red dashed line), for intra-protein co-evolution pairs, homo-oligomeric co-evolution pairs, and hetero-oligomeric co-evolution pairs, respectively. Lower panels: mapping of top co-evolution pairs onto the structure reported here (70% threshold except for the TrwK/VirB4central - TrwM/VirB3 interaction where the 30 top pairs are mapped; in green in Supplementary Table 4). Dashed box in lower left panel locates the structure showed right. Pairs of residues across the interface are linked by red bars. As can be seen from the list in Supplementary Table 4, going down the list, distances greater than the generally accepted 12 Å limit for Cα-Cα distances between interface residues73,74 are found but rank very poorly (pairs in yellow in Supplementary Table 4). a, Plot and mapping of co-evolving residue pairs between TrwK/VirB4central and TrwM/VirB3. b, Plot and mapping of co-evolving residue pairs between TrwE/VirB10CTD and TrwF/VirB9CTD in the OMCC O-layer. c, Plot and mapping of co-evolving residue pairs between TrwK/VirB4outside and TrwG/VirB8tails. See details in Supplementary Table 4 and Methods. Note that residues of TrwK/VirB4outside that interact with α1 residues in TrwG/VirB8tailsA (α1A in Fig. 2e) were not among the top 100 co-evolving residue pairs between these two proteins (Supplementary Table 4), therefore this very small part of our structural model remains unvalidated.

