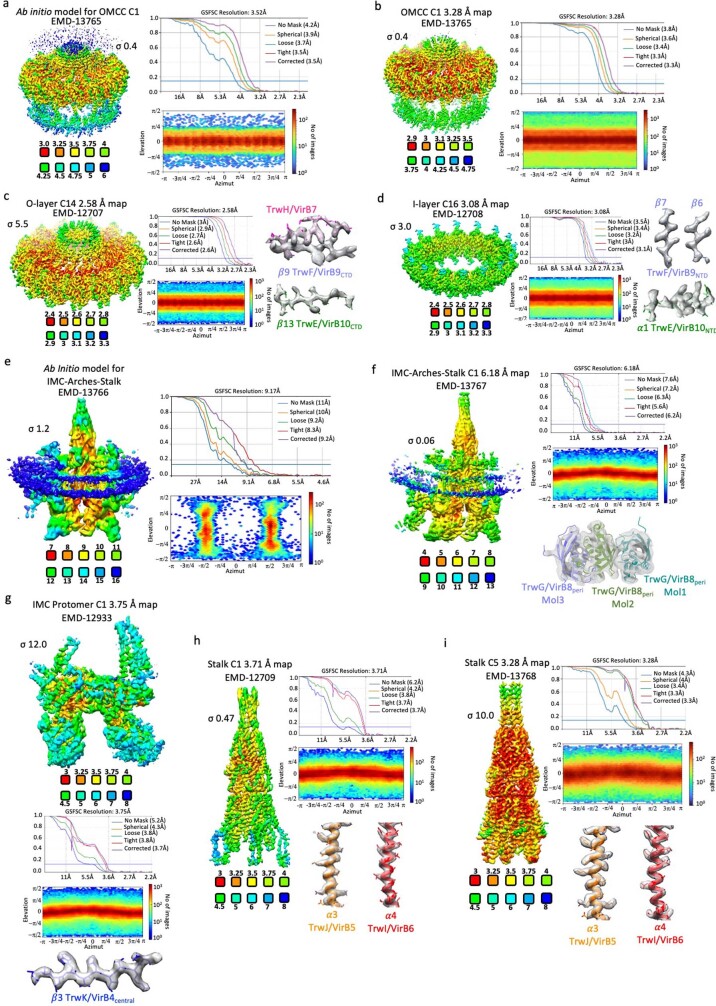
Extended Data Fig. 3. Cryo-EM maps used in this study.
For each map, the density coloured by local resolution, the average resolution derived from Fourier Shell Correlation (FSC), the angular distribution and, for panels c,d,f-i, a representative region of the electron density map with the final model of the T4SS built in it (in stick representation colour-coded as in Fig. 1d) are shown. Local resolution was calculated using CRYOSPARC (FSC cut-off 0.5) and coloured as indicated in the scale below the map. For each map, FSC plots show curves for correlation between 2 independently refined half-maps with no mask (blue), spherical mask (green), loose mask (red), tight mask (cyan) and corrected (purple). Cut-off 0.143 (blue line) was used for resolution estimation. a, the Ab Initio model for the OMCC; b, the OMCC C1 3.28 Å map; c, the O-layer C14 2.58 Å map; d, the I-layer C16 3.08 Å map; e, the Ab Initio model for the IMC-Arches-Stalk; f, The IMC-Arches-Stalk C1 6.18 Å map; g, the IMC protomer C1 3.75 Å map; h, the Stalk C1 3.71 Å map and i, the Stalk C5 3.28 Å map. All maps are sharpened. Contour levels and EMD codes are indicated.

