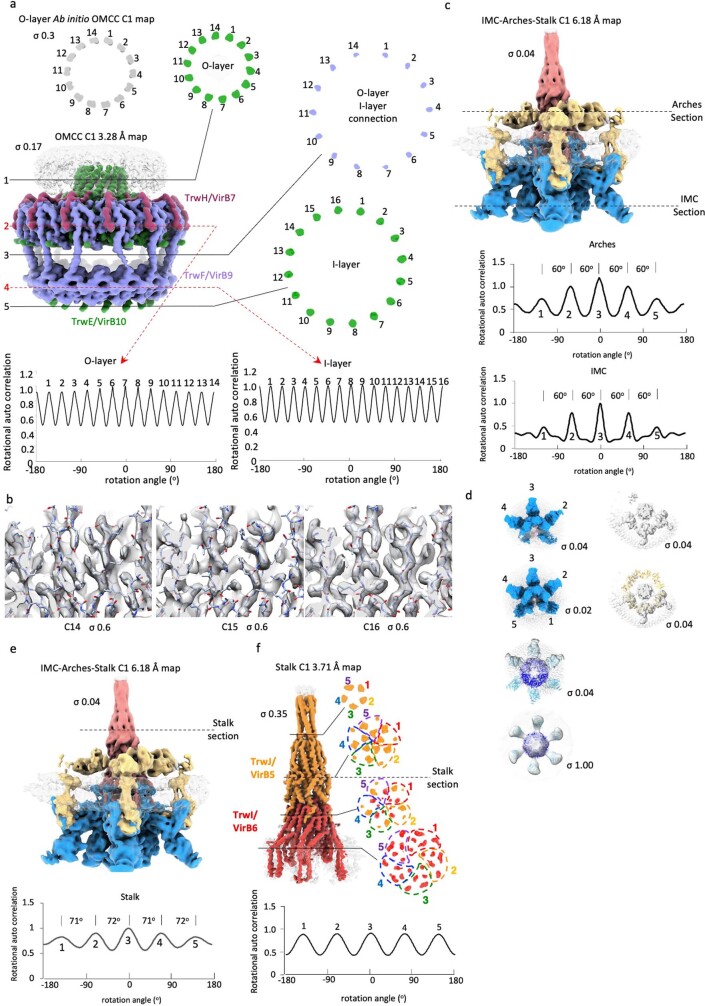
Extended Data Fig. 4. Symmetry analysis of the various T4SS sub-complexes.
a, Symmetry analysis of the OMCC C1 Ab Initio and 3.28 Å maps. Upper left: section of the Ab Initio OMCC C1 map. The section is taken through the helical trans-membrane region of the O-layer. Middle Left: the non-averaged and unsharpened C1 map of the OMCC determined at a resolution of 3.28 Å colour-coded as in Fig. 1d. The contour level is indicated. The three filled lines and two dashed arrows labelled 1 to 5 indicate where the map sections have been taken for analysis shown at right (filled lines) and at bottom (dashed lines in red). Right: three sections of the map shown at left, one for the O-layer, one for the O-layer/I-layer connection, and one for the I-layer. Bottom: IMAGIC rotational auto correlation analysis of sections 2 and 4, independently corroborating C14 and C16 symmetry for the O- and I-layer, respectively. b, I-layer symmetry test. Using the OMCC C1 3.28 Å map (Extended Data Fig. 3b) as reference, three maps were generated using local refinement with a mask encompassing the I-layer and applying either C14, C15, or C16 symmetry. Highest interpretability is observed when C16 is used. The contour levels are indicated. The final model is shown in stick representation color-coded by atoms (red, blue, and white for oxygen, nitrogen, and carbon, respectively). c, Symmetry analysis of the IMC and Arches. Left: IMC-Arches-Stalk C1 6.18 Å unsharpened map colour coded as in Fig. 1b. The contour level is indicated. Two dashed lines through the Arches and the IMC indicate where the map sections have been taken for further symmetry analysis using IMAGIC shown underneath. However, for the Arches section, the section contains both the Arches and the Stalk and therefore, the Stalk region of the section was excluded from the analysis. The symmetry analysis of the IMC shows 5 peaks separated by a ~60° angle indicating 5 IMC protomers organised along a hexagon. A 6th protomer has very weak occupancy: correspondingly, a weak but visible 6th peak is observed in the IMAGIC symmetry analysis. Similar conclusions can be drawn from the analysis of Arches symmetry. d, Further symmetry analysis of the IMC and Arches. Left panels from top to bottom: bottom view of the IMC-Arches-Stalk C1 6.18 Å map coloured in blue and contoured at 0.04 σ level; same map contoured at 0.02 σ level; IMC hexameric model fitted into the same map (now coloured in semi-transparent grey); IMC hexameric model fitted into the cryo-ET map of the F plasmid IMC (EMD-9347 coloured in semi-transparent grey and contoured at 1 σ level; fitting correlation = 0.78). Right panels from top to bottom: section of the Arches and stalk density (0.04 σ level) in the IMC-Arches-Stalk C1 6.18 Å map coloured in semi-transparent grey; fit of the hexameric Arches into the external ring density. e, Symmetry analysis of the Stalk region in the unsharpened IMC-Arches-Stalk C1 6.18 Å map. The dashed line through the Stalk (in red) indicates where the map section has been taken for the symmetry analysis using IMAGIC shown underneath. Regularly spaced peaks spaced by a circa 72° are observed indicating C5 symmetry. f, Symmetry analysis of the non-averaged and unsharpened Stalk C1 3.71 Å map (colour coded orange for TrwJ/VirB5, red for TrwI/VirB6). The four lines indicate where the map slabs/slices shown at right have been taken. At right: four sections of the map shown at left, two for the TrwJ/VirB5 Stalk tip, one for the TrwI/VirB6 Stalk base and one in the middle. For one section, the symmetry analysis using IMAGIC is shown in the lower panel.

