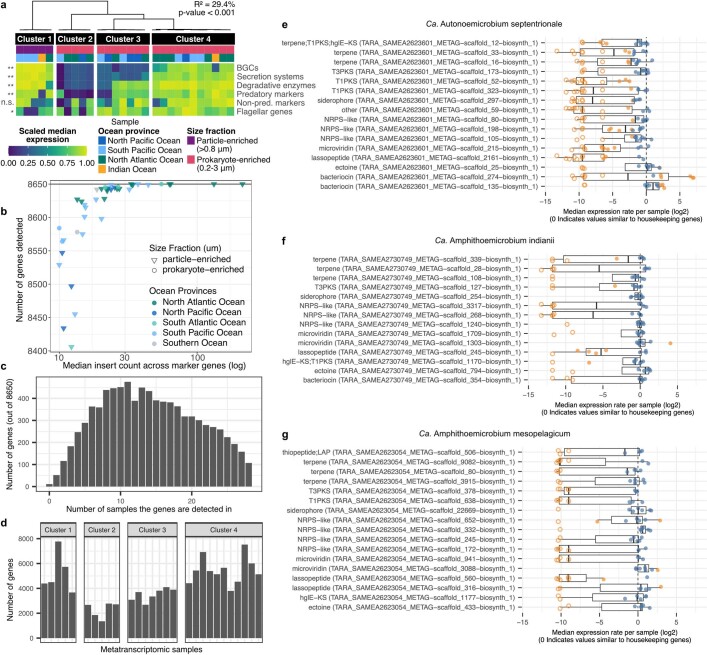
Extended Data Fig. 7. BGCs are the most differentially expressed genes in Ca. E. taraoceanii natural populations are expressed in natura across the Ca. Eudoremicrobiaceae family.
The 28 metatranscriptomic samples used for the Ca. E. taraoceanii expression analyses were selected based on the detection of at least 6 out of 10 universal single-copy marker genes. (a) Four discrete expression states explained 29.4% of the overall transcriptomic variance (PERMANOVA, p-value < 0.001, n = 28) across Ca. E. taraoceanii populations. One state (cluster 1) was exclusive to larger organismal size fractions. Leafs represent transcriptomic profiles and the dendrogram represents dimensionality-reduced distances (Methods). Genes associated with BGCs, secretion systems, degradative enzymes and predatory markers were differentially expressed across the states and represented the most discriminatory categories compared to 200 KEGG pathways (Supplementary Table 4). (b) We investigated the metagenomic detection of the 8,500 genes encoded by the Ca. E. taraoceanii representative, using methodology identical to the transcriptomic analyses (Methods). In samples where the 10 marker genes were detected, we counted the number of genes with one or more insert(s). We found that the 8,500 genes were detected in several ocean basins and different size fractions, with variation in detection rates likely due to variable sequencing depths across samples and datasets. This indicates, at least for the gene set covered by the reconstructed genome, that niche partitioning may be driven by gene expression changes rather than gene content variation. (c) Distribution of the number of genes depending on the number of samples they were detected in. (d) Number of genes detected across the different metatranscriptomic samples. All BGCs encoded by (e) Ca. Autonomicrobium septentrionale, (f) Ca. Amphithomicrobium indianii and (g) Ca. Amphithomicrobium mesopelagicum representatives were found to be expressed in the natural environment (in the 623 Tara Oceans metatranscriptomic samples22,87. Some displayed near constitutive expression while others appear to be tightly regulated across the metatranscriptomes studied here. Filled circles indicate samples where active transcription was detected. Orange data points indicate values below or above a log2 fold change from the constitutive expression rate of housekeeping genes. All the BGCs encoded by Ca. E. taraoceanii were also found to be expressed (Fig. 3c). The expression of Ca. E. malaspinii BGCs could not be investigated since that species was not sufficiently abundant in the epipelagic and mesopelagic ocean, the only layers for which metatranscriptomes were available.

