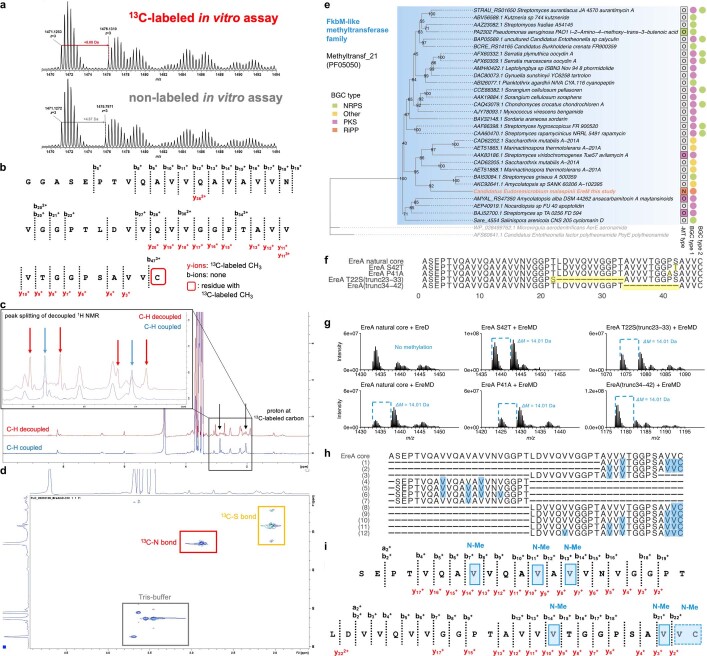
Extended Data Fig. 10. In vitro EreM 13C-labelling experiments, NMR and MS2-fragmentation data; EreM phylogenetic tree; EreM synthetic core mass shifts and MS2-fragmentation data.
(a) Mass spectra of the LahT-digested, single methylated Nhis-EreA from in vitro EreM assays with 13C-labelled SAM (top, red) and non-labelled SAM (bottom, grey). Top: Mass spectrum of the LahT-released 48 aa long EreA core with an N-terminal extension of two glycine residues (m/z = 1471.1263 Da) and the corresponding 13C-labelled methylated (m/z = 1476.1310 Da) core with an N-terminal extension of two leader-derived glycine residues. The mass shift of 5.00 Da (z = 3) is highlighted by a red arrow. Bottom: Mass spectrum of the LahT-released 48 aa long EreA core with an N-terminal extension of two glycine residues (m/z = 1471.1272 Da) and the corresponding methylated (m/z = 1475.7971 Da) core with an N-terminal extension of two glycine residues. The mass shift of 4.67 Da (z = 3) is highlighted by a grey arrow. (b) MS2-fragmentation detected for the 13C-labelled core with an N-terminal extension of two glycine residues (m/z = 1476.1310 Da). All y-ions show masses corresponding to fragments with the addition of a 13C-labelled methyl group (red). All b-ions show masses corresponding to a fragment with no modification (black). The resulting fragmentation pattern suggests 13C-labelled methylation at the C-terminal cysteine residue (red box). MS2-fragmentation data are available in Supplementary Table 5. (c) Overlay of a C-H decoupled (red) and standard (blue) proton NMR of an in vitro EreM assay with 13C-labelled SAM. The peak splitting of the singlets at 2.03 ppm and 2.88 ppm indicates the 13C-H bonds for these protons. (d) HSQC NMR of an in vitro EreM assay with 13C-labelled SAM. The spectrum shows two single signals at 2.03/17.3 ppm (yellow box) and 2.88/25.9 ppm (red box). Another four signals are detected downfield: 3.46/70.0 ppm, 3.55/70.0 ppm, 3.64/62.2 ppm and 3.69/74.6 ppm (grey box). Comparison with the literature suggest the presence of a 13C-S bond at 2.03/17.3 ppm (yellow box) from residual 13CH3-l-methionine and of a 13C-N bond at 2.88/25.9 ppm (red box) from a methylated amide105–109. The remaining four signals are suggested to originate from the Tris-buffer of the reaction mixture (grey box). (e) Maximum-likelihood tree of FkbM-family methyltransferase (PF05050) Hidden Markov Model (HMM) hits within BGCs for natural products in the MIBiG 2.0 database (Supplementary Table 5). Outgroups involved in proteusin biosynthesis from a different methyltransferase protein family (PF05175) are shown in grey text. Branch support values are estimated using the 5,000 ultrafast bootstrap approximation97 in IQ-TREE 296. Letter in ‘MT-type’ column indicates documented N- or O-methyltransferase activity from publications based on genetic knockout or heterologous expression studies (coloured) or bioinformatic evidence, biosynthetic logic, and final natural product structure (grey). To date, EreM from this study is the only FkbM-family enzyme with reported N-methyltransferase activity in a characterized biosynthetic pathway. Coloured points in BGC type columns indicate the majority of FkbM-family enzymes are contained with PKS, NRPS, or Other (e.g., nucleoside antibiotic) biosynthetic pathways. Thus EreM is also the only FkbM-family methyltransferase characterized in a RiPP cluster to date. (f) EreA core variants generated in this study. Mutation or truncation sites are highlighted in yellow. (g) Mass shifts of +14.01 Da corresponding to methylation of the EreA core and variants were observed expressed with EreM as compared to controls without EreM (data not shown for core variants, but results are in accordance with natural core control). All EreA variant + EreM co-productions were tested with and without EreD, but EreD co-productions are pictured. since epimerized (EreA + EreD) cores have better solubility and higher concentrations. (h) Proteinase K-generated fragments of the wild-type EreA core following co-productions with EreIMD reveal a mixture of variable methylation patterns. (i) MS2-fragmentation of the wild-type EreA core after co-production with EreIMD. Mass shifts corresponding to up to 6 non-radical methylations (+84.09 Da) were observed and were localized to valine residues (highlighted in light blue, N-Me). Dashed lines around boxes indicate uncertainty regarding the position. MS2-fragmentation data are in Supplementary Table 5.

