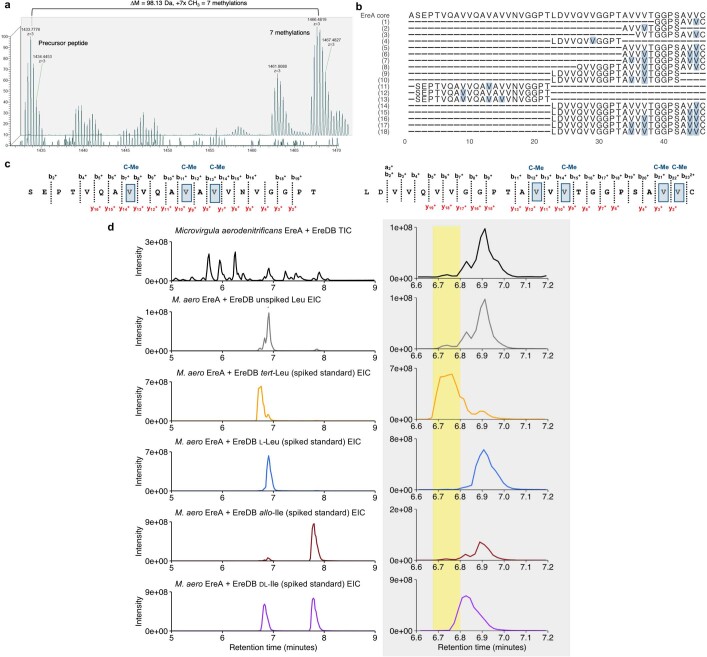
Extended Data Fig. 12. EreB mass shift, MS2-fragmentation data and advanced Marfey's analysis for tert-Leu.
(a) Co-production of Nhis-EreA with epimerase EreD and the B12-dependent radical SAM C-methyltransferase EreB in M. aerodenitrificans Δaer with a knocked-out aeronamide BGC yielded a mixture of C-methylated products with mass shifts corresponding to up to 7 methylations (+98.13 Da). (b) Alignment of a mixture of differently-modified fragments detected by MaxQuant analysis of proteinase K digested Nhis-EreA following co-productions with EreDB. (c) Representative MS2-fragmentation of EreA core following co-production with EreDB at m/z = 1466.4819 Da. Observed and calculated masses for b- and y-ions are in Supplementary Table 5. Modification sites (dark blue, C-Me) were localized to V9, V13, V15, V35, V37, V44, and V45. (d) Total ion chromatogram (TIC, black) and EICs from advanced Marfey’s analysis of C-methylated core from co-productions of EreA + EreDB in M. aerodenitrificans. The unspiked sample (dark grey) is compared to identical samples that were spiked with synthetic standards: tert-Leu (orange), l-Leu (blue), allo-Ile (brown), and dl-Ile (purple). The grey box is an inset on a narrower retention time from the left panel highlighting a peak shoulder from the M. aerodentrificans EIC corresponding to tert-Leu (yellow shading).

