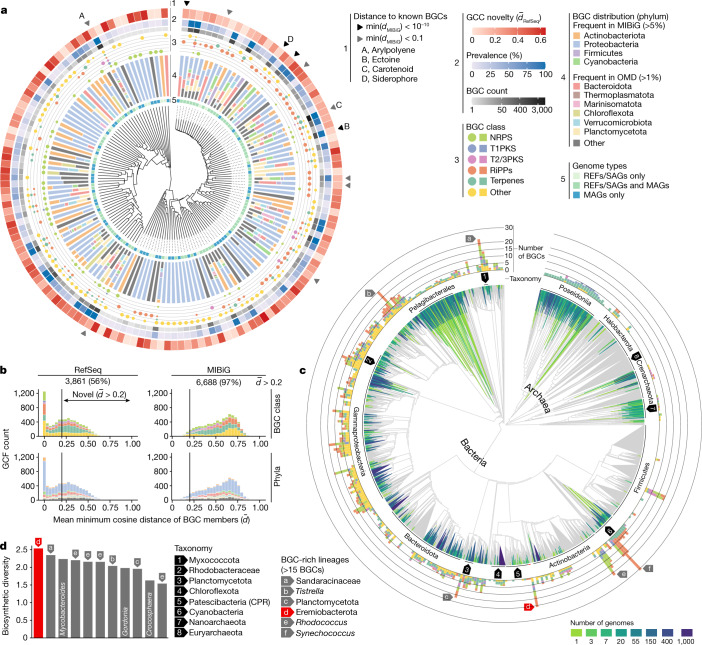
Fig. 2. Novelty and phylogenomic distribution of the ocean microbiome biosynthetic potential.
A total of 39,055 BGCs were clustered into 6,907 GCFs and 151 GCCs. a, Representation of the data (inner to outer layers). Hierarchical clustering based on BGC distances of the GCCs, 53 of which were captured only by MAGs. GCCs comprise BGCs from different taxa (ln-transformed phylum frequencies) and different BGC classes (circle sizes correspond to their frequencies). The outer layers indicate, for each GCC, the number of BGCs, the prevalence (percentage of samples) and the distance (minimum cosine distance of BGCs (min(dMIBiG))) to BGCs from BiG-FAM. GCCs with BGCs closely related to experimentally validated BGCs (MIBiG) are highlighted by arrows. b, Comparing GCFs to computationally predicted (BiG-FAM) and experimentally validated (MIBiG) BGCs uncovered 3,861 new (d– > 0.2) GCFs. Most of them (78%) encode RiPPs, terpenes and other putative natural products. c, All genomes in the OMD detected across 1,038 ocean metagenomes were placed onto the GTDB backbone trees to reveal the extent of the phylogenomic coverage of the OMD. Clades without any genome in the OMD are coloured grey. The number of BGCs corresponds to the highest number of predicted BGCs per genome in a given clade. For visualization, the last 15% of the nodes were collapsed. The arrows denote BGC-rich clades (>15 BGCs) with the exception of Mycobacteroides, Gordonia (next to Rhodococcus) and Crocosphaera (next to Synechococcus). d, An unknown species of ‘Ca. Eremiobacterota’ displayed the highest biosynthetic diversity (Shannon index based on natural product types). Each bar represents the genome with the highest number of BGCs within a species. T1PKS, type I PKS; T2/3PKS, type II and III PKS.

