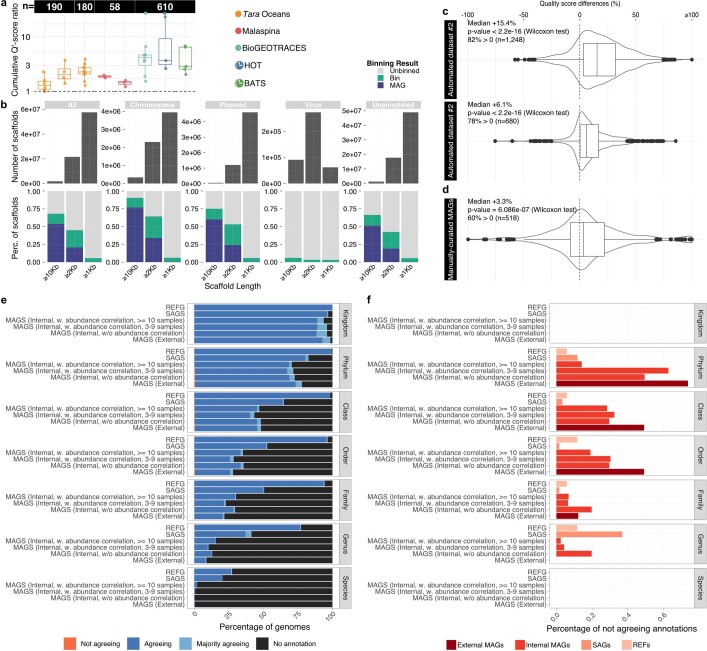
Extended Data Fig. 2. Impact of abundance correlation on MAGs recovery and quality, quality improvement over other ocean MAGs datasets, recovery of mobile genetic elements and evaluation of genome chimerism.
(a) In this study, MAGs were reconstructed using abundance correlation information (Extended Data Fig. 1b) (Methods), which resulted in both higher cumulative quality scores per sample and individual quality scores per MAG. The ratio of cumulative quality scores (Supplementary Information) of MAGs binned with and without differential coverage information was on average (median) 2.3 across the different datasets. Per individual MAGs, a mean quality score increase of 20% was achieved. The number of samples used for differential coverage profiling are indicated above the boxplots. The colours of the boxplots reflect the different datasets as indicated in Fig. 1b. (b) We investigated the bin membership of > 80 M scaffolds across size and fragment type. These scaffolds were annotated to identify chromosomes, plasmids and phages (Supplementary Information). The difference between chromosomes and plasmids binning rates provides an evaluation of the bias of the MAG reconstruction against hypervariable regions within the genomes. Annotations were integrated to classify scaffolds as follows, chromosomes (‘eukrep = Prokarya & plasflow prediction = chromosome & cbar prediction = Chromosome & plasmidfinder plasmid = NaN & deepvirfinder p-value > 0.05 & virsorter score = NaN’), plasmids (‘(plasmidfinder plasmid != NaN | (plasflow prediction = plasmid & cbar prediction = Plasmid)) & eukrep = Prokarya & virsorter score not in [1, 2] & deepvirfinder p-value > 0.05’), viruses (‘virsorter score > = 1 & deepvirfinder p-value < 0.01 & eukrep = Prokarya & plasflow prediction != plasmid & cbar prediction != Plasmid’) or unannotated. By benchmarking the quality of the MAGs reconstructed in this study (Supplementary Information), we found that combining single-sample assemblies with large-scale abundance correlations achieved on average significantly higher community-defined quality scores60 than and (c) two datasets of automatically generated MAGs, dataset #1100 and dataset #225, and (d) even manually curated MAGs26. ‘n’ denotes the number of possible comparisons (i.e. number of shared species) with the different MAGs sets. All genomes in the extended OMD were evaluated for chimerism using the taxonomic annotation of 10 universal single copy marker genes (Supplementary Information). (f) For each taxonomic level, the genomes were classified as: “No annotation” if a maximum of one gene out of 10 was annotated; “Agreeing” if all genes had the same annotation; “Majority agreeing” if more than half agreed and “Not agreeing” otherwise. The evaluation was split for the genomes origin (y-axis). (g) Percentage of “Not agreeing” annotations over all the annotated clades (i.e. the sum of “Agreeing”, Majority agreeing” and “Not agreeing”). Notably, across all MAGs the rate of disagreement was < 1% with that rate being ~0.1% for MAGs with differential coverage index ≥ 10 (i.e. 75% of the MAGs), suggesting the added value of abundance correlation in reducing the rates of chimera.

