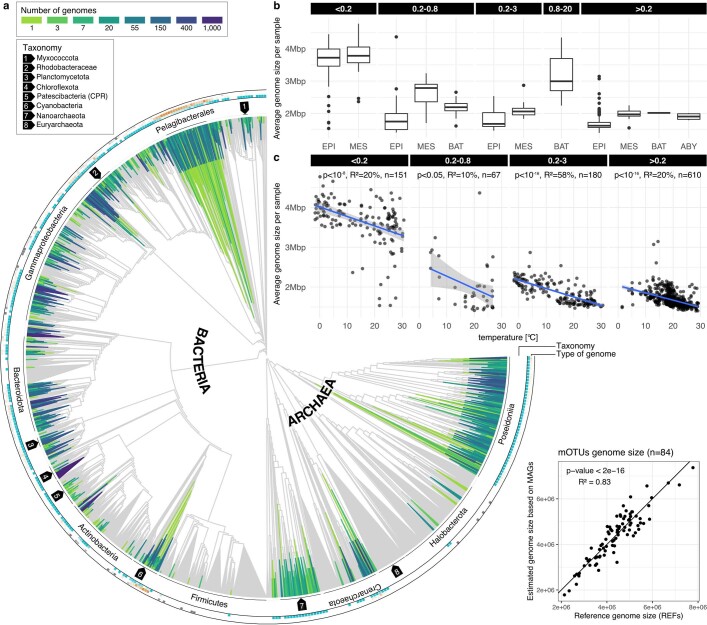
Extended Data Fig. 3. Different genome reconstruction strategies capture complementary phylogenomic diversity; trends in community genome sizes across the global ocean microbiome.
(a) Reconstructed MAGs, external MAGs, SAGs as well as REFs detected across the set of 1,038 ocean metagenomes were placed on the GTDB backbone trees13 revealing that the different genome types (MAGs, SAGs and REFs) capture complementary phylogenomic diversity. Similar to Fig. 3, the green-to-blue colours of the branches indicate the number of genomes in that part of the tree. The inner layer denotes the taxonomy of specific clades (some indicated by arrows due to limited space). The outer layer represents the percentage of genomes across the binned tree for each genome type. Clades without any genome from the OMD were left in grey. For visualization purposes, the last 15% of the nodes are collapsed. (b, c) The average genome size per sample was significantly larger in deeper waters (Kruskal Wallis test, p-value < 2*10−16, n = 1,038) and was inversely correlated with temperature (linear model). (d) Comparing genome sizes from MAG-based predictions and reference genomes for 85 mOTUs (species-level) clusters with at least one reference genome. Genome sizes are estimated using MAGs of good quality and above only (completeness above 70%), a criteria that is met for > 80% of the mOTUs clusters.

