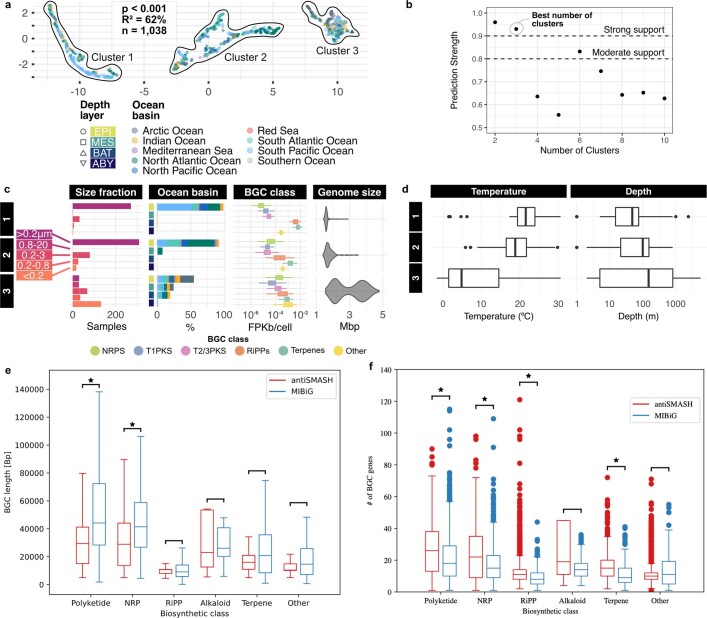
Extended Data Fig. 4. Structure and drivers of the ocean microbiome biosynthetic potential; evaluation of BGC completeness using length and number of genes between predicted and characterized BGCs.
(a) The abundances of GCFs (Methods) were used to compute distances between the 1,038 metagenomic samples. Using dimension reduction and density based clustering (Methods), we identified three sample clusters. (b) A prediction strength analysis strongly supports clustering the data into 3 groups (largest number of clusters above the 0.9 threshold). This is also confirmed by the Silhouette Index (data not shown). (c) These clusters were broken down by community origin, including size fractions, depth layers and ocean basins. We found significant differences in BGC class abundances (FDR-corrected pairwise Wilcoxon tests, p-value < 10−7, n = 1,038) and average genome sizes (FDR-corrected pairwise Wilcoxon tests, p-value < 2*10−16, n = 1,038) (Methods) between the clusters (Supplementary Table 2). (d) We found temperature and depth to be significantly different between the sample clusters identified based on biosynthetic potential composition (Kruskal Wallis test, p-value < 2*10−16, n = 1,038). RiPP - Ribosomally synthesized and Post-translationally modified Peptide; NRPS - Non-Ribosomal Peptide Synthetase; T1PKS - Type I Polyketide Synthase; T2/3PKS - Type II and III Polyketide Synthases. BGC length distributions across BGC classes are not significantly different (Wilcoxon test, significance denoted by ‘*’ with p-value < 10−5, n >> 30) between the set of BGCs studied in this work (antiSMASH) and the characterized BGCs in MIBiG with the exception of the polyketides and non-ribosomal peptide synthetases, which may be expected based on the particularly large clusters they can encompass (e) and the BGCs studied in this work (antiSMASH) to have a similar or higher number of genes than the characterized BGCs in MIBiG (f).

