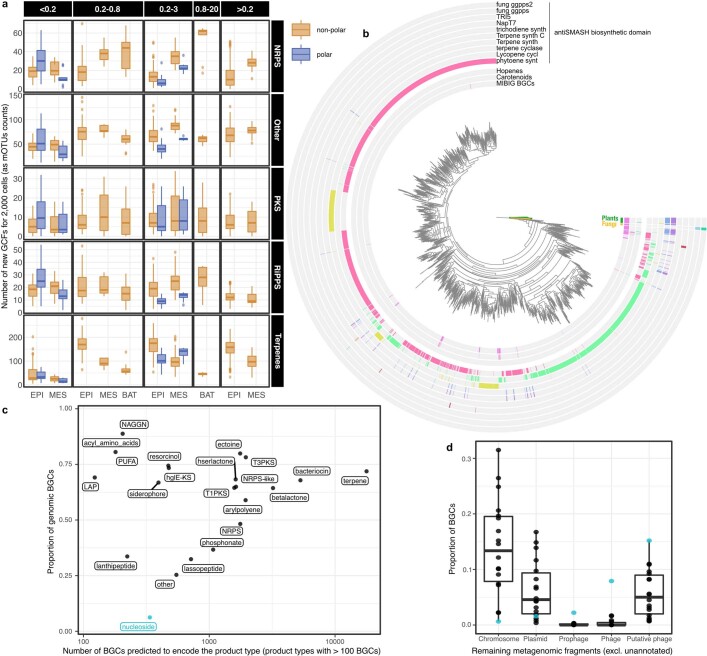
Extended Data Fig. 5. GCF novelty across latitude, depth layers and size fractions for each BGC class and distribution of nucleoside BGCs across genomic and metagenomic fragments.
(a) We estimated the discovery potential of different microbial communities by counting the number of new GCFs (Methods) detected in a sample after rarefaction of per-cell GCFs abundance profile to 2,000 cells. Although well studied communities (non-polar epipelagic prokaryote-enriched (0.2–3 µm) and virus-depleted (>0.2 µm)) displayed the highest discovery potential for terpenes, least explored communities (polar, deep, virus- and particle-enriched) were found to have the highest potential for NRPS, PKS, RiPPs or other natural products discovery. Polar is defined as absolute latitude > 60º. NRPS: Non-Ribosomal Peptide Synthetases; PKS: Polyketide Synthase; RiPP: Ribosomally Synthesized and Post-translationally modified Peptide. (b) An overview of the putative terpenoid diversity. A phylogenetic tree of all terpene biosynthetic core genes (as defined by antiSMASH) identified in the OMD, in the context of the 195 MIBiG terpene biosynthetic core genes, provides an overview of the terpenoid diversity and novelty. Briefly, the 31,398 terpene biosynthetic core genes identified across all predicted BGCs were filtered (length > = 120aa, removing < 2% of the sequences), dereplicated (using MMSEQS2 13.45111101 clustering, 60% identity) into 2,904 protein sequences and aligned with the 195 MIBiG proteins using MAFFT v7.310102. The resulting alignment was trimmed with trimal to remove positions with more than 50% gaps and used to build the tree using FastTree v2.1.10103. The inner annotation layers indicate whether a gene is coming from a MIBIG cluster and if this one was annotated as a carotenoid or hopene cluster. The outer layers correspond to the biosynthetic core gene domain according to antiSMASH categories. Plants were used to root the tree. (c) Investigation of the proportion of BGCs binned within a MAG by product type showed that nucleosides were most rarely encoded in MAGs. (d) Breakdown by fragment type of the BGCs in the remaining metagenomic fragments. Strikingly, nucleoside BGCs were rarely encoded on predicted chromosome fragments and most often in predicted phage fragments (Supplementary Information). For this analysis, we refined the prediction described in Extended Data Fig. 2b with prophages (‘virsorter category = prophage & virsorter score > = 1 & eukrep = Prokarya & plasflow prediction != plasmid & cbar prediction != Plasmid’), phages (‘virsorter category = phage & virsorter score > = 1 & deepvirfinder p-value < 0.01 & eukrep = Prokarya & plasflow prediction != plasmid & cbar prediction != Plasmid’) and putative phages (not in phages & ((‘virsorter category = phage & virsorter score > = 1) | deepvirfinder p-value < 0.05) & eukrep != Eukarya & plasflow prediction != plasmid & cbar prediction != Plasmid’).

