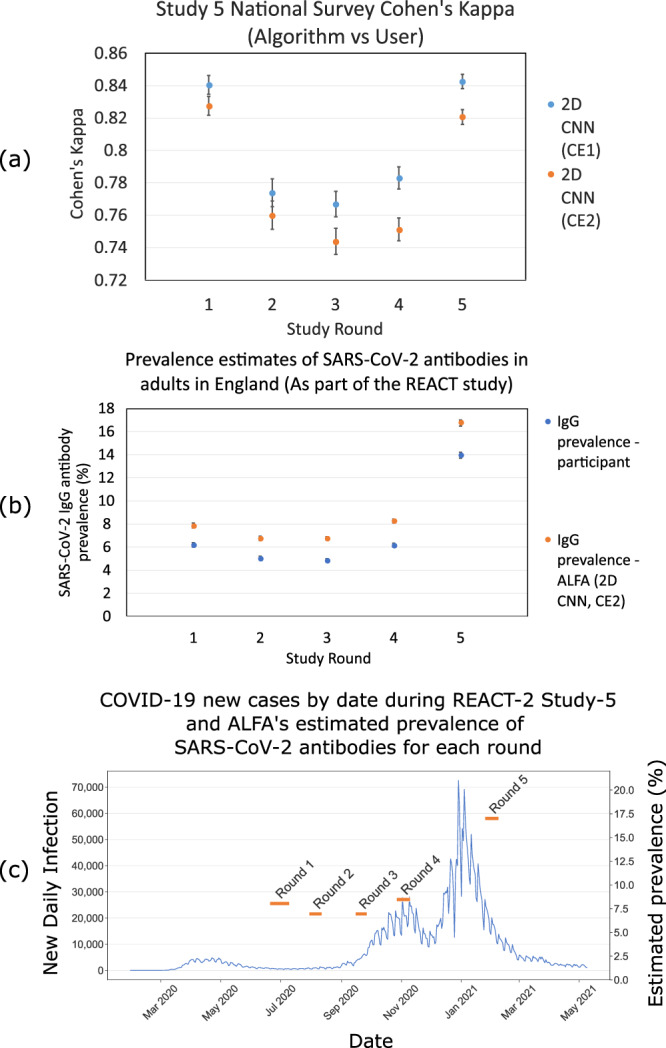
Fig. 3. Comparison between automated lateral flow analysis (ALFA) pipeline and REACT-2 Study-5 participants.

a Cohen’s kappa between the two 2D Convolutional Neural Network (CNN) algorithms developed as part of the ALFA pipeline and study participants for REACT-2 rounds 1 to 5 (Respectively for each round, N = 93252, N = 95508, N = 123614, N = 133225, N = 140240). 2D CNN (Classification Experiment 2 (CE2), Blue) and 2D CNN (Classification Experiment 1 (CE1), Orange) indicate strong Cohen’s kappa, suggesting that participants are very good at reading their own results throughout the series of surveys. 2D CNN (CE1) is likely to have higher agreement than 2D CNN (CE2) because CE2 is picking up a greater proportion of weak positives, some of which are being missed by participants. The ALFA pipeline suggests substantial agreement between (0.70) participants’ readings and the ALFA pipeline, providing confidence in the self-reading of fingerprick blood home self-testing LFIA kits. Error bars represent a 95% confidence interval. b Estimated prevalence of SARS-CoV-2 Immunoglobin G (IgG) antibodies in adults in England in the REACT-2 study by i) participant-reported results (Blue) and ii) ALFA (2D CNN CE2, Orange) automated read-out. Error bars represent 95% confidence interval, respectively for each round, N = 88557, N = 94291, N = 122211, N = 131327, N = 138200. c ALFA (2D CNN CE2, Orange bars) estimated antibody prevalence (Respectively for each round, N = 88557, N = 94291, N = 122211, N = 131327, N = 138200) overlaying daily new test positive COVID-19 cases (Blue line graph, Data acquired from GOV.UK here: https://coronavirus.data.gov.uk/).
