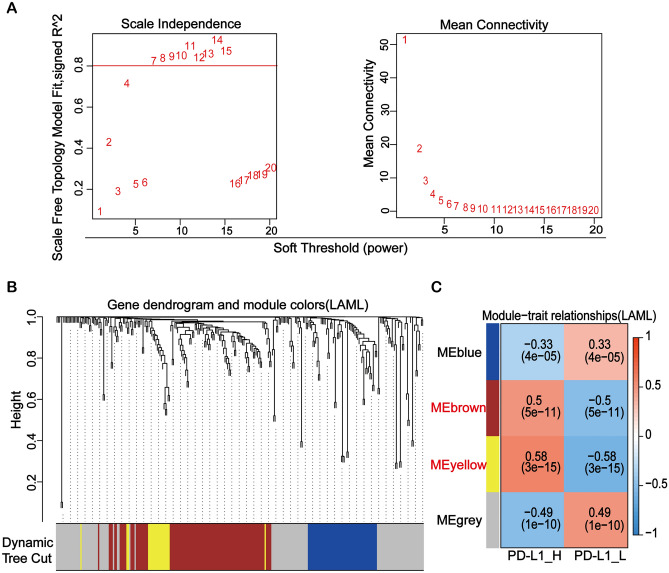
Figure 3.
Identification of pivotal PD-L1-related modules using weighted gene co-expression network analysis. (A) Analysis of the mean connectivity and scale independence for adjusting soft-threshold powers. (B) The genes in topological overlap matrix were divided into gene sets by Dynamic Tree Cut, and four modules were generated. (C) Confirmation of four key modules of DEGs clustering and overview of the correlation between the modules and PD-L1 expression.

