Figure 4.
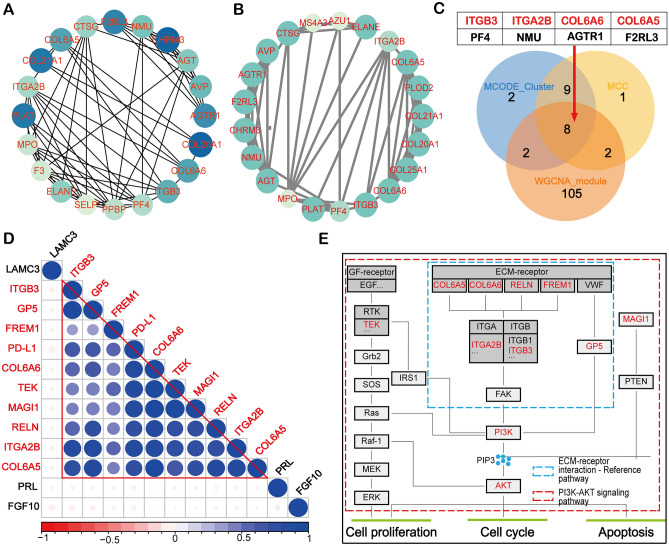
Identification of key PD-L1 related genes. (A) Protein–protein interactions (PPI) displayed the top 20 important proteins of differentially expressed genes using MCC algorithm. The color darkness indicates the importance of the protein in the network. (B) A key sub-network consisting of 21 nodes was constructed by the plug-in MCODE in Cytoscape. (C) The Venn diagram showed eight PD-L1 related genes by overlapping the WGCNA module gene set (117 genes), the MCC algorithm gene set (20 genes) and the MCODE sub-network gene set (21 genes). (D) Correlation analysis of PD-L1 and enriched genes in PI3K-AKT signaling pathway and ECM-receptor interaction. Blue represents positive correlation and red represents negative correlation. (E) Overall recapitulation of DEGs enriched in the ECM/PI3K-AKT signaling pathway.

