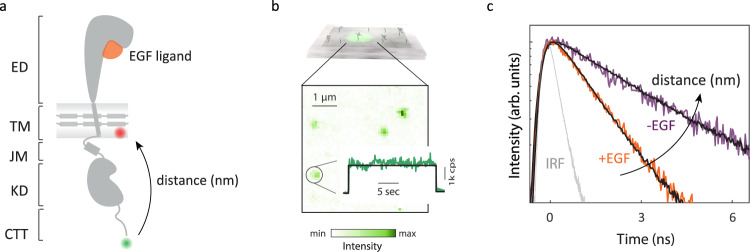
Fig. 1. smFRET measures intracellular conformational states of full-length EGFR in a nanodisc.
a Full-length, monomeric EGFR (solid gray) embedded in a nanodisc. The nanodisc is a lipid bilayer (shaded gray) belted by an amphiphilic apolipoprotein (solid gray). EGFR consists of a 621-amino acid extracellular region (ED) that binds EGF (orange), a 24-amino acid transmembrane-spanning domain (TM), and an intracellular region, which is a 37-amino acid juxtamembrane domain (JM), a 273-amino acid kinase domain (KD) and a 231-amino acid disordered C-terminal tail (CTT) (Supplementary Fig. 1). Green and red spheres indicate the donor and acceptor dyes, respectively. b Top: Ni-NTA coated coverslip binds EGFR nanodiscs via a His-tag on the apolipoprotein. Bottom: fluorescence intensity from a confocal image for a representative region (λexc = 550 nm) where green spots are immobilized EGFR nanodiscs. Number of detected photons for each 100 ms interval generates a fluorescence intensity trace (green) with the average intensity indicated (black). c Histogram of the arrival times of detected photons generates the donor lifetime decay profile. Representative decay profiles of EGFR in the presence (orange) and absence (purple) of the EGF ligand in a neutral bilayer with fit curves (black). The instrument response function (IRF) is shown in gray.

