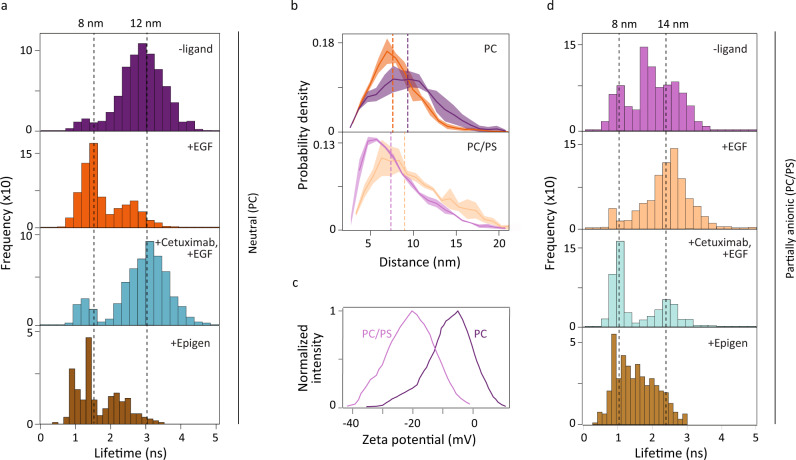
Fig. 2. smFRET and MD simulations reveal extracellular/intracellular conformational coupling in EGFR.
smFRET measurements (a, d) were used to build histograms of the donor lifetime, which shortens as the donor-acceptor distance decreases. Dotted lines indicate the medians with corresponding distances on upper x-axis. a The donor fluorescence lifetime distribution in DMPC (PC) bilayer without ligand (top); with 1 μM EGF (second); with 1 μM EGF and 100 nM Cetuximab (third); with 1 μM epigen (bottom). b Molecular dynamics trajectories were used to find the probability density distribution of the vertical separation in a PC bilayer (top) or a POPC-POPS (PC/PS) bilayer (bottom) without EGF (purple) and with EGF (orange). Dotted lines indicate the median of the distributions (PC bilayer: 9.2 nm (-EGF) and 7.5 nm (+EGF); PC/PS bilayer: 7.4 nm (−EGF) and 9.0 nm (+EGF)). The shaded regions represent the standard deviation estimated with block averaging. c Zeta potential distributions for EGFR in PC (dark purple) and PC/PS (light purple) nanodiscs. d The donor fluorescence lifetime distribution in PC/PS bilayer without ligand (top); with 1 μM EGF (second); with 1 μM EGF and 100 nM Cetuximab (third); with 1 μM epigen (bottom). Source data are provided as a Source data file.

