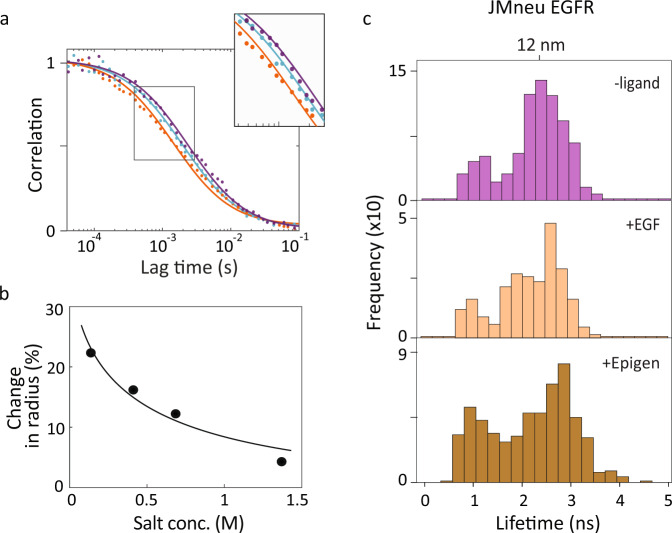
Fig. 3. Charged residues implicated in extracellular/intracellular conformational coupling.
a FCS curves of WT EGFR (dots) were fit (solid lines) to extract a diffusion time of 1.5 ms in the presence of EGF (orange), 2.2 ms in the absence of EGF (purple), corresponding to a reduction of 22% in hydrodynamic radius, and 1.9 ms in the presence of Cetuximab together with EGF (cyan). b Percent change in hydrodynamic radius from FCS curves in the presence of EGF relative to in the absence of EGF (dots) as a function of salt concentration with Debye-Huckel fit curve (solid line). c smFRET donor fluorescence lifetime histograms for JMneu EGFR in POPC-POPS bilayer without ligand (top); with 1 μM EGF (second); with 1 μM epigen (bottom). All the three sets of histograms are statistically similar to each other (Supplementary Fig. 14). Source data are provided as a Source data file.

