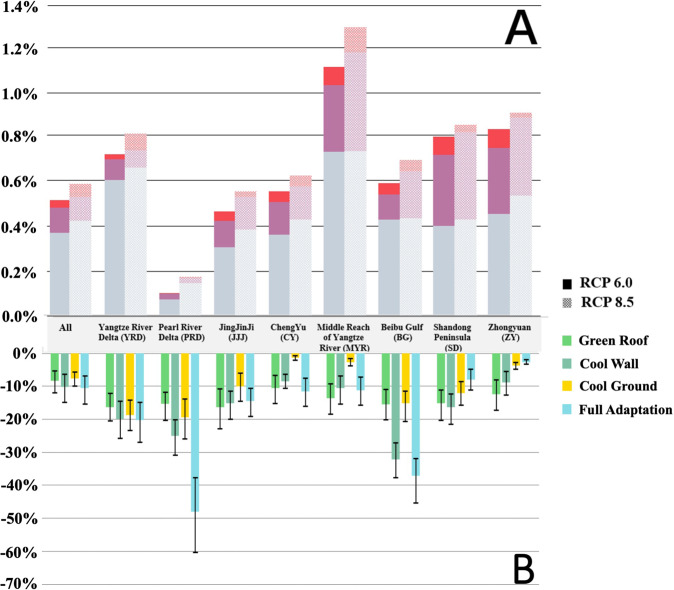
Fig. 4. Changes in the total GDP loss compared to the baseline scenario and the fraction of the economic losses that can be prevented via the implementation of adaptation strategies in all urban grids.
The percentages in the upper panel (A) indicate the percentage increases in the economic losses due to urban warming under the RCP 6.0 and RCP 8.5 scenarios with SSP2 by the 2050s relative to the 2010s, and the three colors indicate the total contribution of the three sectors. The percentages in the lower panel (B) indicate the annual percentage reductions in the economic losses due to the different urban adaptation strategies (2050–2060) under RCP 6.0 compared to the additional increases in the economic losses in the future relative to the baseline level. Error bar refers to the standard deviation of the results from 2050 to 2060.

