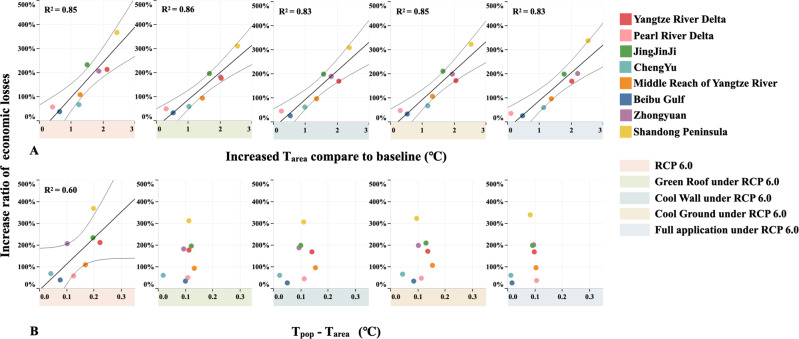
Fig. 5. Relationships among the increase in the ratio of economic losses, Tarea increase, and heat exposure increase induced by the resident distribution (Tpop – Tarea).
A Relationships between the increase in the ratio of economic losses and Tarea increase under the different scenarios in individual urban agglomerations. B Relationships between the increase in the ratio of economic losses and resident distribution-induced increase in heat exposure. Linear regression is performed with a one standard deviation confidence interval. The bold lines indicate that the linear relationship is statistically significant at the 0.05 level.

