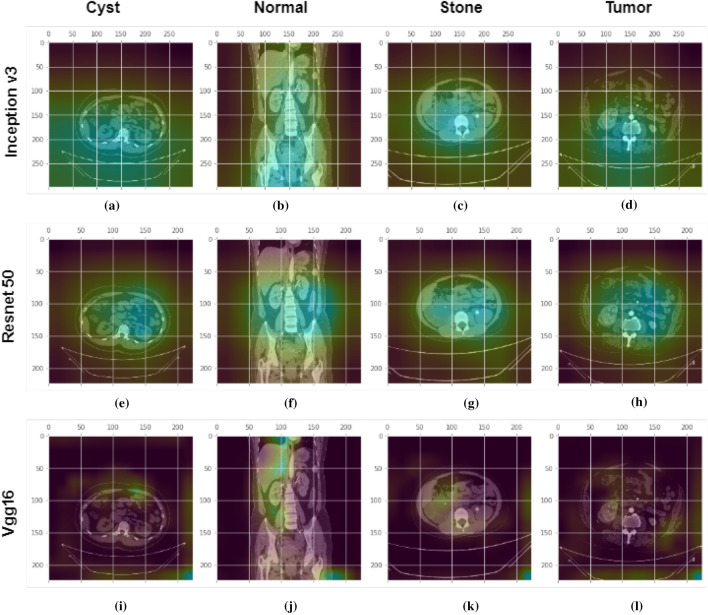
Figure 14.
GradCam analysis of kidney Cyst, Normal, Stone and Tumor class photos at the final convolution layer in the Inception v3, Vgg16, and Resnet models. First row: shows the Gradcam images from inception v3 model for different classes. Second row: shows the Gradcam images from Resnet50 model for different classes. Third row: shows the Gradcam images from Vgg16 model for different classes. The GradCam activation mapping for the xray image is shown in the second row. The first, second, third, and fourth columns are for kidney cysts, normal, stone, and tumor classes respectively.

