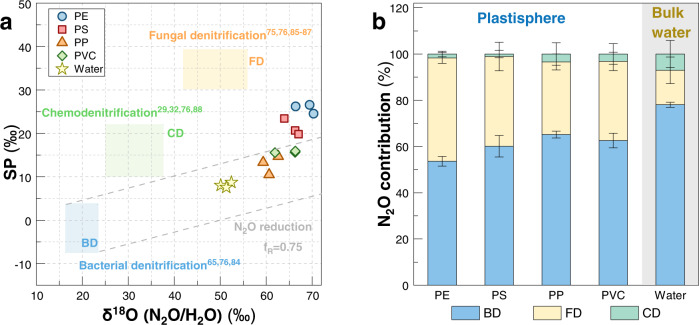
Fig. 5. Multiple-isotope signatures of N2O illustrating the relative contributions of bacterial denitrification (BD), fungal denitrification (FD), and chemodenitrification (CD) in the plastisphere and bulk water.
a Relationships between N2O-SP and N2O-δ18O (N2O/H2O) values in each group. N2O-δ18O values were corrected for H2O-δ18O assuming almost complete O exchange. Ranges of putative isotope signatures of N2O (δ18O (N2O/H2O)) from BD, FD, and CD are indicated as the three color boxes. The corresponding references are listed in the figure. The area enveloped by gray dash lines represents the N2O reduction through BD process based on fractionation effects (slope=SPεN2O/δ18OεN2O = 0.25). This mapping approach is modified from the method in ref. 83. b Relative proportions of N2O production via BD, FD, and CD in the plastisphere and bulk water. Errors were estimated by Monte Carlo simulation and reflected the accuracy of N2O isotope mass balance model. Although the contributions of each denitrification process would shift with the prescribed extent of oxygen change and N2O-SP and N2O-δ18O values, all ranges suggest that biotic denitrification instead of chemodenitrification was the main contributor to N2O production in the plastisphere and bulk water.

