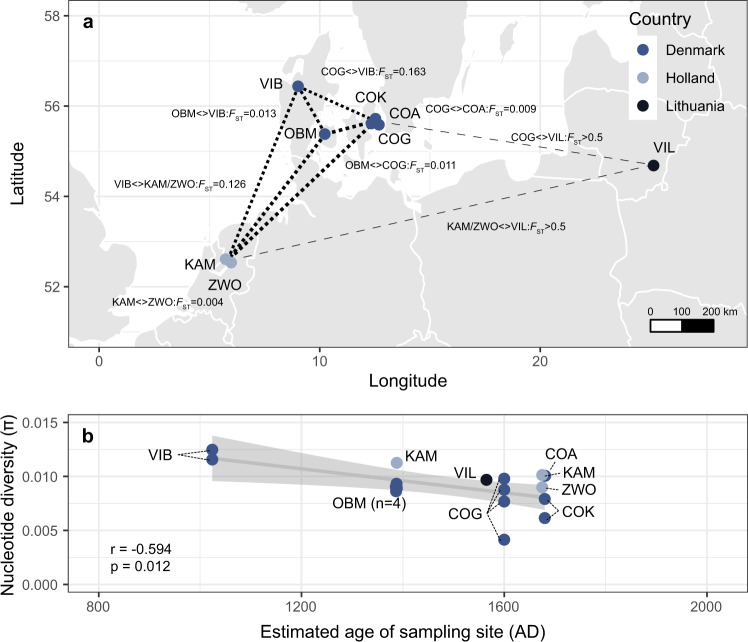
Fig. 2. Changes in ancient parasite diversity across space and time.
a Genetic differentiation between ancient sample sites based on pairwise estimates of mitochondrial genome diversity (pooled sample FST) is shown. The width of the dashed line connecting pairs of sample sites reflects the degree of similarity between mitochondrial genomes. b Comparison of the levels of nucleotide diversity (π) within the ancient mitochondrial genomes over time. Pearson’s correlation (r) and associated p-value (cor.test; two-sided; adjusted p-value [“holm”]), together with the linear regression (grey trendline line) and 95% confidence level interval (grey shaded area), are shown. Samples are coloured based on the scheme in Fig. 1. Sample site abbreviations: COA = Adelgade, Copenhagen; COG = Gammel Strand, Copenhagen; COK = Kultorvet, Copenhagen; OMB = Odense By Midte; VIB = Viborg; KAM = Kampen; ZWO = Zwolle; VIL = Vilnius.

