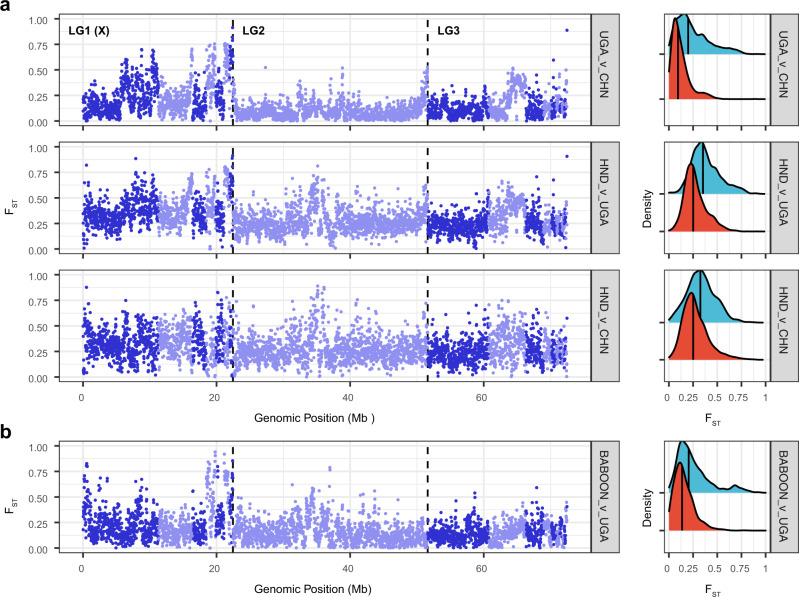
Fig. 4. Genome-wide comparison of genetic variation between populations.
a Comparison of genome-wide genetic differentiation between human-infective T. trichiura from genetically and geographically defined populations. Pairwise FST was measured in 20 kb windows between China and Uganda (top), Uganda and Honduras (middle), and China and Honduras (bottom). Alternating dark and light blue colours represent different scaffolds, with the vertical dashed lines separating the three chromosomal linkage groups (LG). The sex-linked linkage group is indicated as LG1 (X). b Comparison of closely related human-infective Ugandan and baboon-infective T. trichiura. Sample abbreviations: CHN = China; UGA = Uganda; HND = Honduras. Density plots in a and b show the distribution of FST values for the sex-linked (blue) and autosomal (red) scaffolds. The median FST value for each is shown (solid vertical line).

