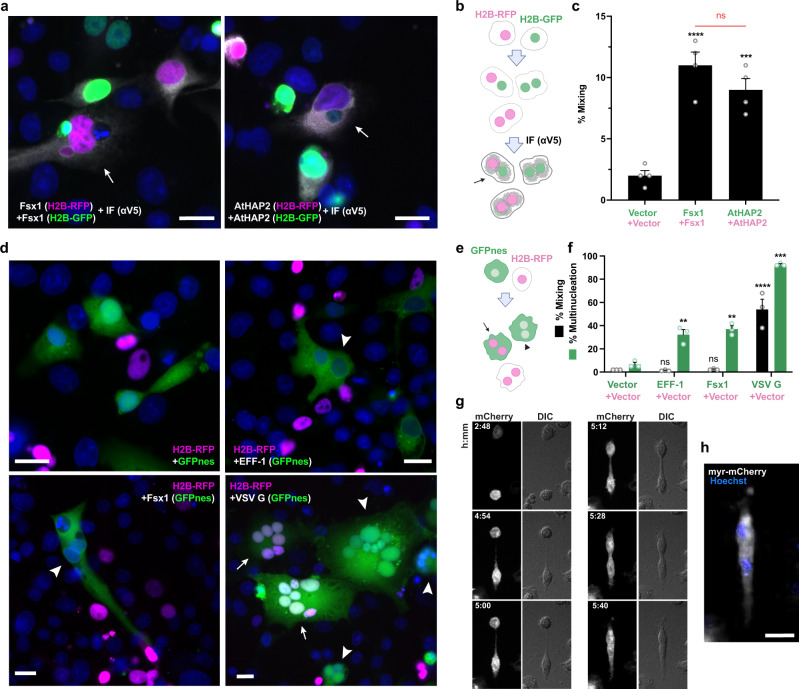
Fig. 4. Fsx1 mediates bilateral cell–cell fusion.
a–c Cell–cell fusion was measured by content-mixing, indicated by the appearance of multinucleated cells containing green nuclei (H2B-GFP) and magenta nuclei (H2B-RFP). Immunofluorescence against the V5 tag was also performed (gray). a Images of mixed cells. DAPI, blue. Scale bars, 20 µm. See also Supplementary Fig. 7a. b Scheme of experimental design. c Quantification of content-mixing. The mixing indices presented as means ± SEM of four independent experiments. Comparisons by one-way ANOVA followed by Bonferroni’s test. ns = non-significant, ***p < 0.001, ****p < 0.0001. Source data are provided as a Source Data file. d–f Unilateral fusion was evaluated by mixing control cells expressing nuclear H2B-RFP (magenta) with cells expressing GFP with a nuclear export signal (GFPnes, green cytoplasm) only or together with Fsx1, EFF-1 or VSV G. d Images of cells transfected with empty::GFPnes vector, Fsx1::GFPnes, EFF-1::GFPnes or VSV G::GFPnes. Fsx1 and EFF-1 show multinucleated GFPnes positive cells (arrowheads). VSV G multinucleated cells are found with GFP only (arrowheads) or with both markers (arrows). Scale bars, 20 µm. See also Supplementary Fig. 7e. e Scheme of experimental design. f Quantification of content-mixing experiments in which only the GFP population of cells express Fsx1, EFF-1, VSV G, or none of them (vector). Bar chart showing means ± SEM of three independent experiments. Comparisons by one-way ANOVA followed by Dunett’s test against the vector. ns = non-significant, **p < 0.01, ***p < 0.001, ****p < 0.0001. Source data are provided as a Source Data file. g Spinning disk microscopy time-lapse images indicating the merging of two cells expressing myr-mCherry and Fsx1. Time in hours:minutes. The red channel (mCherry, white) and the DIC are shown. Refer to Supplementary Movie 1. h For the last point a Z-projection showing the myr-mCherry fluorescence (white) and the nuclei Hoechst (blue; Supplementary Movie 2). Scale bar, 20 µm.

