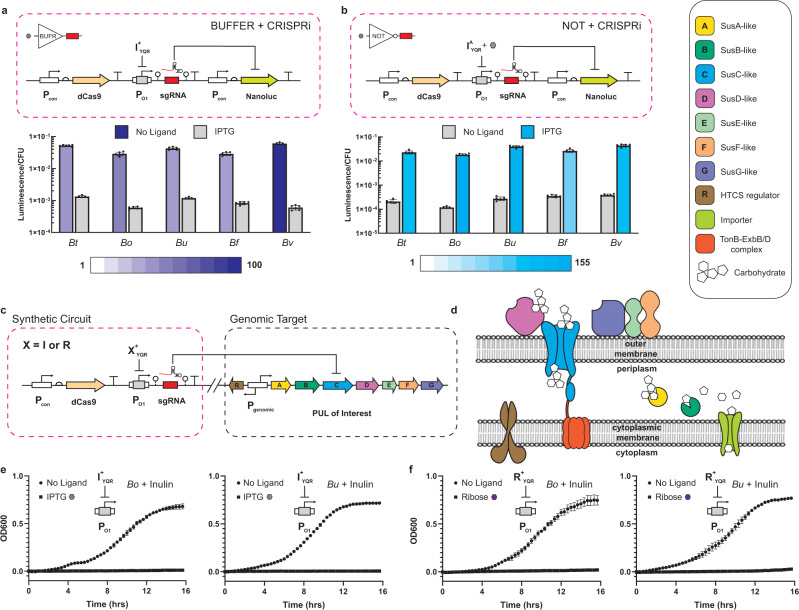
Fig. 4. Coupling transcriptional programming with CRISPR interference.
a Wiring diagram for NanoLuc knockdown based on a BUFFER gate controlling a sgRNA (top). I+YQR was used to regulate a sgRNA targeting the NanoLuc gene. Strains harboring the circuit were grown in the absence and presence of 10 mM IPTG and assayed for luciferase activity (bottom) (Methods). Dynamic range is illustrated with shading according to the legend below the graph (purple representing anti-induction, blue representing induction) and is calculated as described previously. b Wiring diagram for NanoLuc knockdown based on a NOT gate controlling a sgRNA (top). IAYQR was used to regulate a sgRNA targeting the NanoLuc gene. Strains harboring the circuit were assayed as in a to determine performance (bottom). c Wiring diagram of CRISPRi circuit targeting endogenous SusC-like genes. Strains were created with X+YQR (X = I or R) regulating a sgRNA specific to the SusC homolog of interest. d Cartoon of PUL organization, highlighting the function of the SusC-like importer. Colors of proteins and complexes correspond to the genes shown in c and are listed in the legend at the top right corner. e Growth curves of B. ovatus (left) and B. uniformis (right) harboring circuits shown in c with I+YQR as the sgRNA regulator. Strains harboring CRISPRi circuits were grown in the absence and presence of 10 mM IPTG in minimal media containing inulin as the only carbon source (Methods). f Similar to e, but the sgRNA regulator is now R+YQR. Strains harboring these circuits were grown in the absence and presence of 1 mM D-ribose in inulin minimal media. Source data are provided as a Source Data file. For luciferase assays, data represent the average of n = 6 biological replicates. For OD600 growth curves, data represent the average of n = 3 biological replicates. Error bars correspond to the SEM of these measurements.

