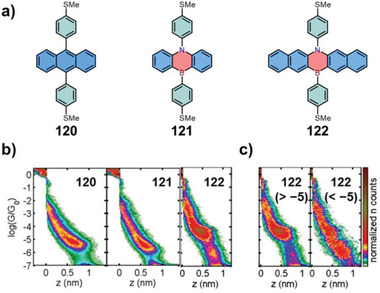
Figure 5.

a) Chemical structures of compounds 120–122. b) 2D histograms for compounds 120–122. c) Independent 2D histograms of two separated groups for 122: traces without and with plateaus below log(G/G 0) = −5, respectively. Reproduced with permission.[ 50 ] Copyright 2021, Wiley‐VCH.
