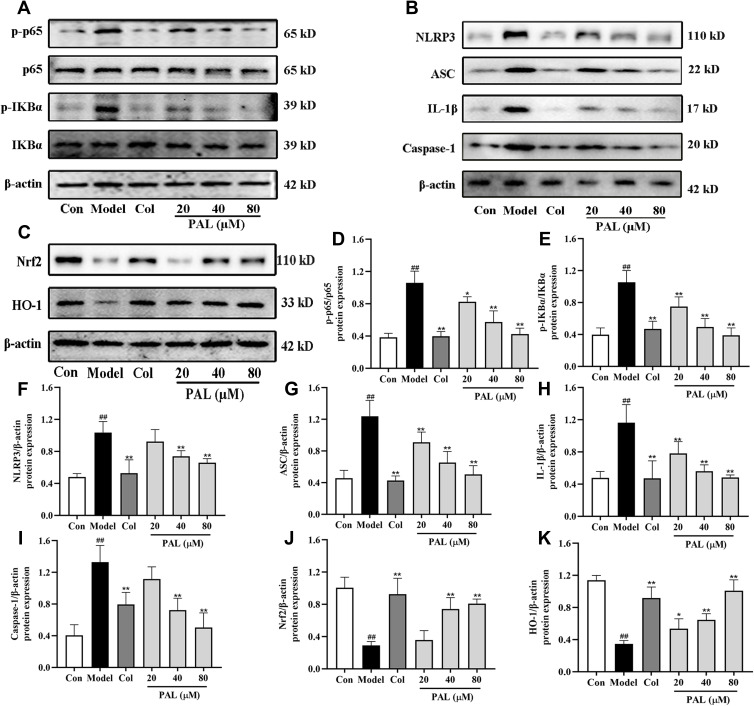
Figure 5.
Effects of PAL and Col (1 µM) on NF-κB/NLRP3 and Nrf2 signaling pathways in LPS plus MSU-activated THP-1 cells. (A) Representative Western blotting images of p-p65, p65, p-IKBα, IKBα and β-actin. (B) Representative Western blotting images of NLRP3, ASC, IL-1β, Caspase-1 and β-actin. (C) Representative Western blotting images of Nrf2, HO-1 and β-actin. Changes in the relative protein expression levels of p-p65/p65 (D), p-IKBα/IKBα (E), NLRP3 (F), ASC (G), IL-1β (H), Caspase-1 (I), Nrf2 (J) and HO-1 (K). Data are shown as mean ± SD (n = 3); ##P < 0.01 vs Control group; *P < 0.05, **P < 0.01 vs Model group.

