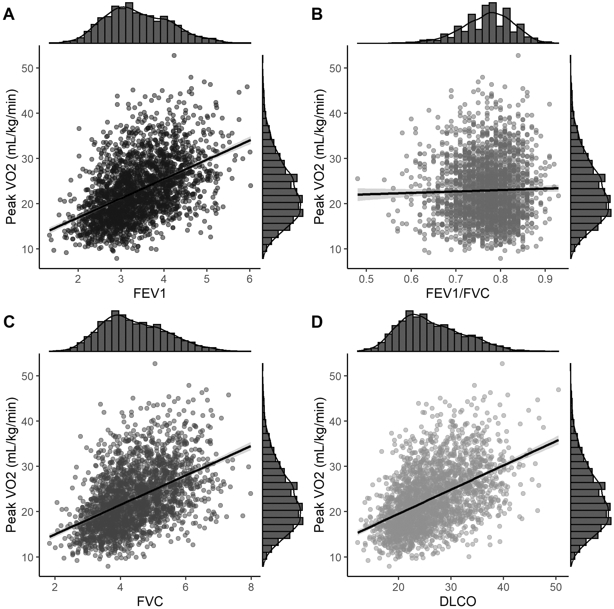
Figure 2: Unadjusted associations of lung function measurements with peak oxygen consumption.

Scatter plots displaying the relationship of peak VO2 within FEV1 (Panel A), FVC (Panel B), FEV1/FVC (Panel C), and DLCO (Panel D). An unadjusted linear fit to the datapoints is included with a 95% confidence bands. Histograms of each variable are included on the margins.
Raw data display of A. FEV1, B. FVC, C. FEV1/FVC D. DLCO with relative peak VO2 with the dots representing individual participants
