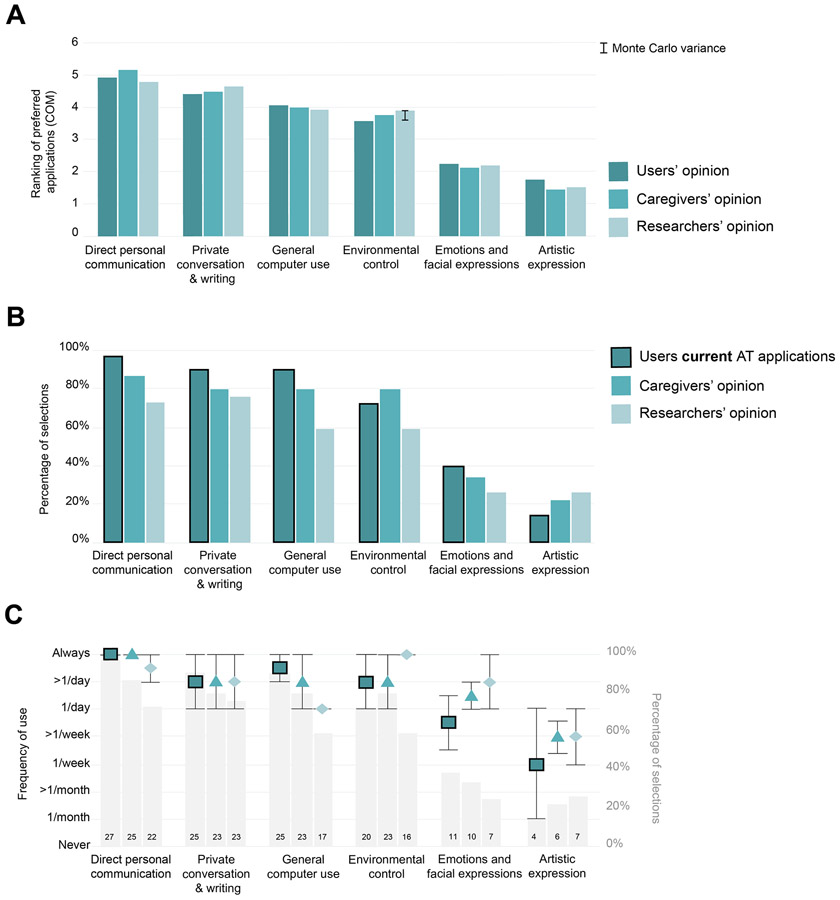
Figure 3 – Comparison between users’ current AT application and expected cBCI applications.
A) Ranking of preferred applications to be supported by a cBCI, using the center-of-mass (COM) metric. Meaningful differences between groups were estimated using the Monte Carlo variance indicated on the top right corner (0.32). In addition, the size of the Monte Carlo variance is indicated on top of the one bar that showed a larger-than-Monte-Carlo-variance difference from users. Rating scales ranged from 1 (least preferred) to 6 (most preferred). B) Percent of users that have a specific AT application currently available at home (dark green, highlighted with black line) compared with the importance of these applications as rated by the caregivers (green) and researchers (light green). C) Median and median absolute deviation (error bars) of how often each application was (estimated to be) used. Of note, the frequency of usage of each application was computed from the number of participants that selected that specific application in B (gray bars; units in the right-side y-axis; copies of the information given in B).

