Figure 7.
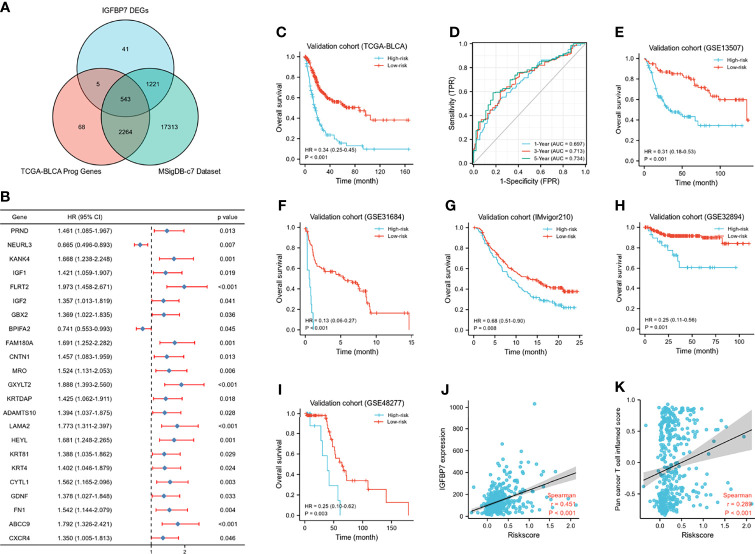
Development of IGFBP7-based immune risk model. (A) Venn diagram showing the candidate gene set. (B) Forest plot of the correlation between the candidate genes and prognosis in BLCA. (C, D) Kaplan-Meier survival curve analysis of the low- and high-risk in TCGA training set and the predictive accuracy of risk model for survival. (E–I) Validation of the risk model in five external independent sets: GSE13507, GSE31684, GSE32894, GSE48277, IMvigor210. (J, K) Correlations between riskscore, expression of IGFBP7 and pan-cancer T cell inflamed score.

