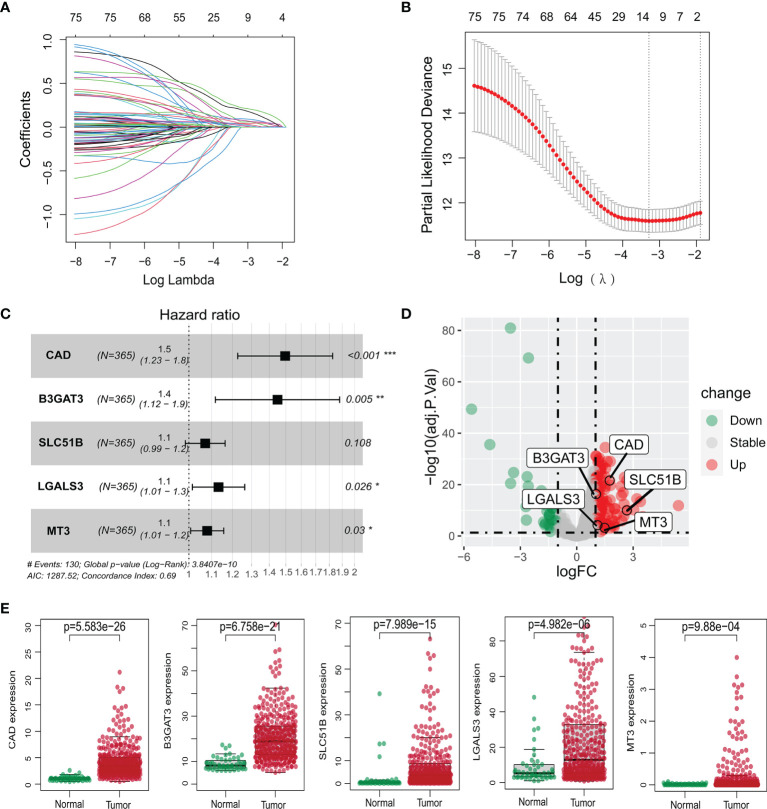
Figure 2.
Construction of the prognostic model of the TCGA-LIHC cohort. (A, B) Lasso regression analysis of survival-associated genes. (C) Multivariate Cox regression confirming five glycosylation-related genes. (D) Volcano plot of differentially expressed genes between HCC and non-tumor tissues. The five genes are marked. Red: significant upregulation; blue: significant downregulation; grey: no statistical significance. (E) Expression levels of five glycosylation-related genes between normal and HCC samples. *P <0.05; **P <0.01; *** P <0.001.

