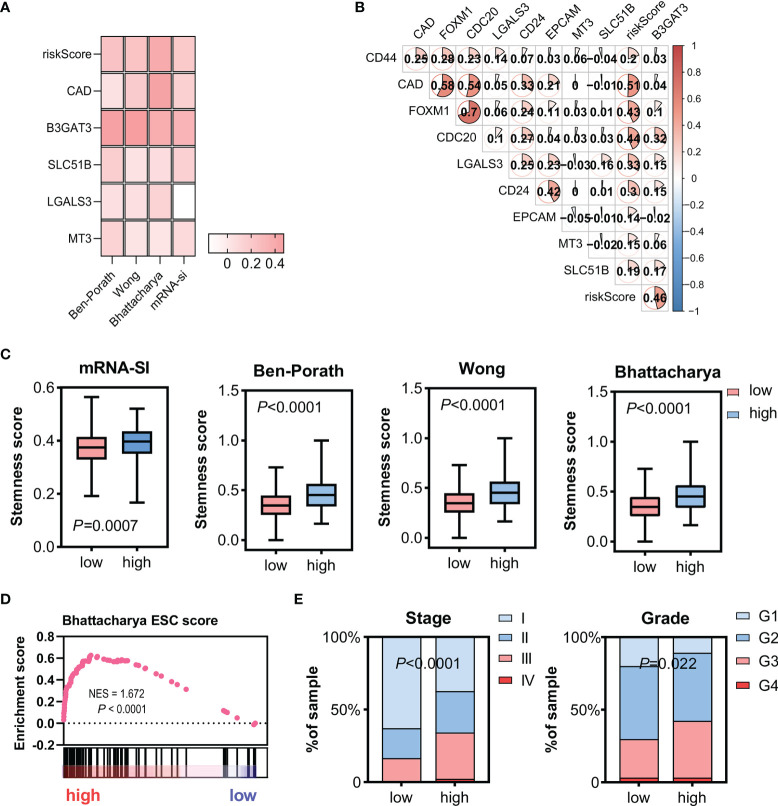
Figure 3.
Relationship between gene expression profiles and HCC stemness using HCC bulk data from TCGA-LIHC. (A) Heatmap of Spearman’s correlation results of the gene expression profiles and four distinct stemness indices (Ben-Porath signature, Wong signature, Bhattacharya signature, and mRNA-si). A darker color represents a stronger correlation. (B) Correlation between the CSC markers, CD24, CD44, CD20, FOXM1, and EpCAM, and the gene expression profiles. (C) Different scores of the four distinct stemness indices between the low- and high-risk groups. (D) The transcriptome profiles of high-risk HCC patients were significantly enriched with stemness markers. (E) Among the high-risk patients, the frequency of higher stages and grades was more significantly elevated. Tumor stages and grades were color-coded as shown in the legend. NES, normalized enrichment score; CSC, cancer stem cells.

