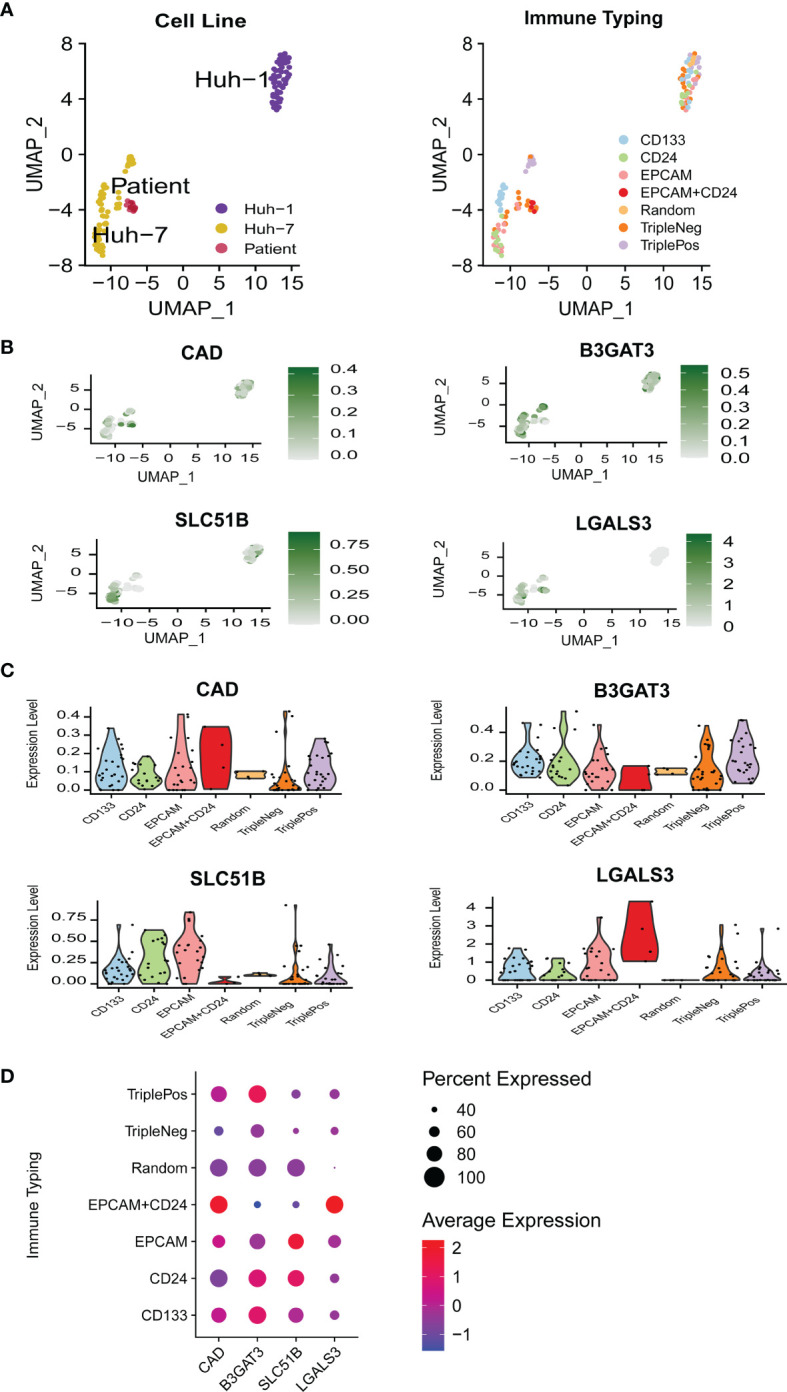
Figure 4.

The relationship between gene expression profiles and HCC stemness in single-cell RNA-sequencing data. (A) UMAP plots of 130 single cells using different classifications. (B) UMAP plots of the four glycosylation-related genes in CSC (MT3 was not detected in GSE 103866). (C) Violin plots of the four glycosylation-related gene expressions in CSC. (D) Expression of the four glycosylation-related genes in different immune phenotypes. CSC, cancer stem cells.
