Figure 7.
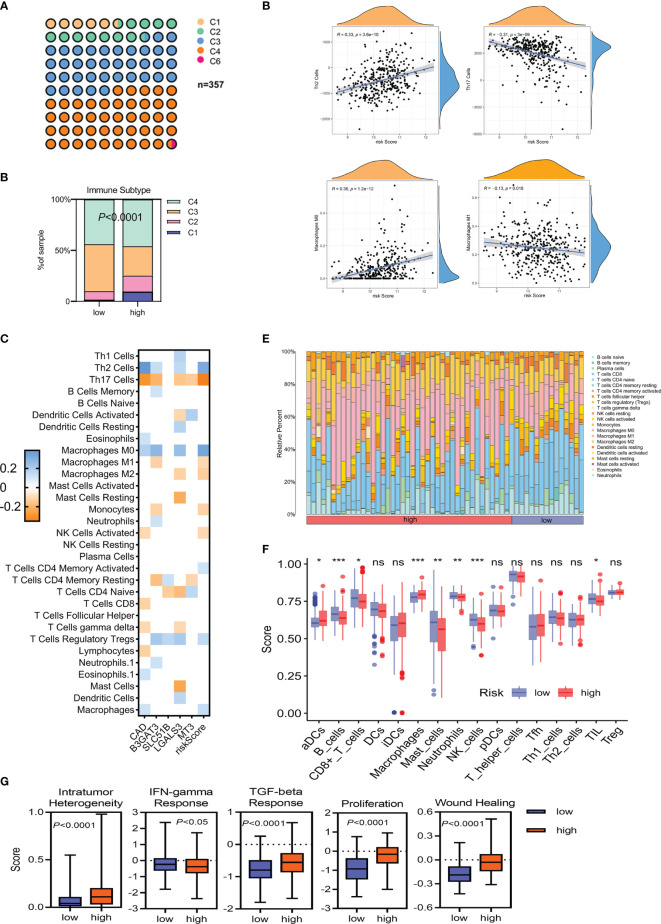
The immune landscape of HCC tumors in TCGA-LIHC. (A, B) Classification of low- and high-risk HCC tumors into C1–C6 classes. C1, wound healing; C2, IFN-γ dominant; C3, inflammatory; C4, lymphocyte depleted; C6, TGF-β dominant. (C) Heatmap of Spearman’s correlation between transcriptome profiles, risk scores, and immune infiltration. Only statistically significant correlations are shown (P <0.05). (D) Spearman’s correlation of Th2/Th17 infiltration, M0/M1 macrophage infiltration, and the glycosylation-based risk score. (E, F) Different relative proportions of immune cells in different groups. (G) Scores of the five distinct immune indices between the low- and high-risk groups. *P <0.05; **P <0.01; ***P < 0.001, ns, not significant.

