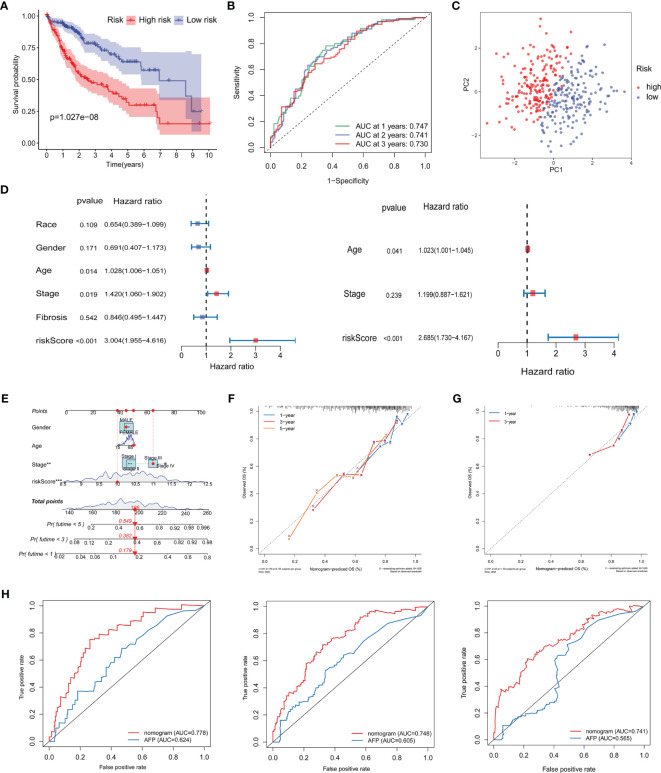
Figure 8.
Validation of the prognostic signature and establishment of a novel nomogram. (A) Kaplan–Meier curve analysis of the low- and high-risk groups. (B) ROC curve showing the prognostic risk model. (C) PCA plot of TCGA-LIHC patients in different risk groups. (D) Univariate and multivariate independent prognostic analysis of clinical features and risk scores. (E) Nomogram for survival prediction in TCGA-LIHC. (F, G) Nomogram calibration curves of 1-, 3-, and 5-year survival probabilities in TCGA-LIHC and ICGC-LIRI-JP, respectively. (H) ROC curves of the nomogram and AFP for the survival prediction at 1-, 3-, and 5-years. ROC, receiver operating characteristic; AUC, areas under the receiver operating characteristic curve; PCA, Principal component analysis; AFP, alpha-fetoprotein; OS overall survival.

