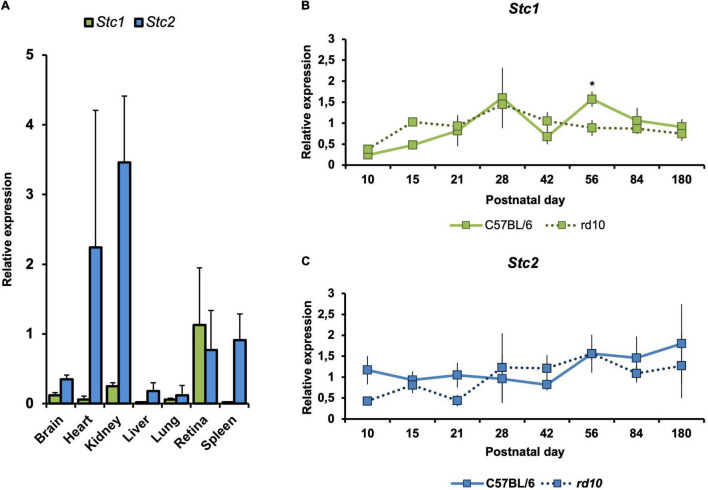
FIGURE 1.
Gene expression of Stc1 and Stc2 in the retina during postnatal development, aging and degeneration. (A) Relative expression levels of Stc1 (green bars) and Stc2 (blue bars) in different tissues isolated from 11 weeks old wild type (C57BL/6) mice. Relative expression levels of Stc1 (B) and Stc2 (C) in the retina of wild type (C57BL/6) mice (solid line) and rd10 mice (dotted line) from PND10 to PND180. Expression was determined by semi-quantitative real-time PCR and normalized to Actb levels. Shown are mean values ± SD of N = 3. *P < 0.05. Two-way ANOVA with Sidak’s multiple comparison test.

