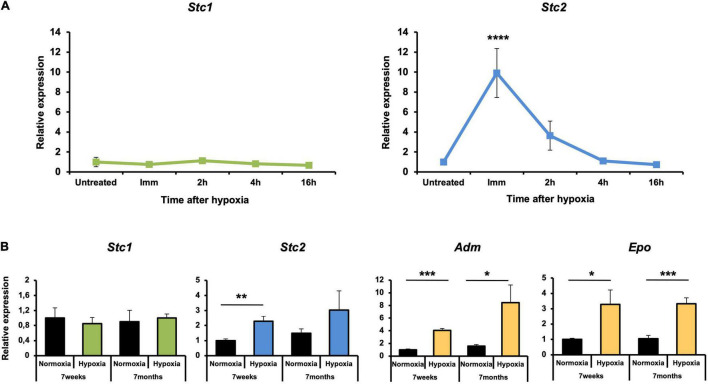
FIGURE 2.
Upregulation of Stc2 gene expression in response to hypoxia. (A) Relative expressions of Stc1 (left panel) and Stc2 (right panel) in retinas of 6 weeks old wild type (Balb/c) mice exposed to hypoxia (6 h, 7% O2). Tissue was collected immediately after hypoxia (Imm) or after 2, 4, and 16 h of reoxygenation following hypoxia. (B) Relative expression of Stc1, Stc2, Adm, and Epo in retinas of wild-type (129S6) mice exposed to normoxia (black bars) or hypoxia (tissue collected immediately after 6 h at 7% O2) (colored bars) at 7 weeks or 7 months of age. Expression levels were determined by semi-quantitative real-time PCR, normalized to Actb and shown relative to the levels in untreated controls (set to 1) (A) or to normoxic controls at 7 weeks of age (set to 1) (B). Shown are mean values ± SD of N = 3. Significance was tested using one-way ANOVA with Dunnett’s multiple comparison test (A) and by Student’s t-test (B) (*P < 0.05, **P < 0.01, ***P < 0.001, P < 0.0001****).

