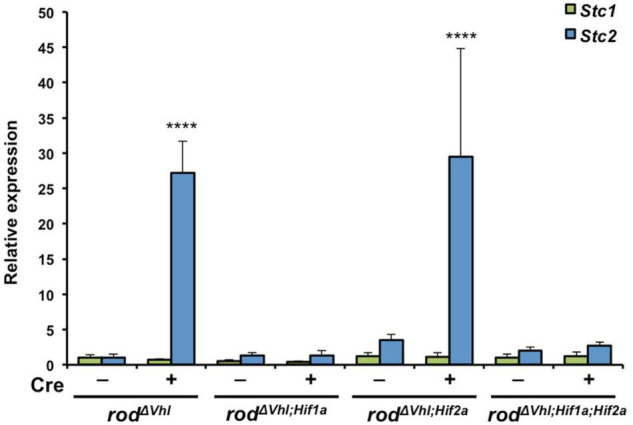
FIGURE 3.

Upregulation of Stc2 upon stabilization of HIF1A in rod photoreceptors. Relative expression of Stc1 (green bars) and Stc2 (blue bars) in rodΔVhl, rodΔVhl;Hif1a, rodΔVhl;Hif2a, and rodΔVhl;Hif1a;Hif2a mice and their control lines that carried the respective floxed genes without Opsin-cre (–). Expression was determined by semi-quantitative real-time PCR and normalized to Actb levels. Shown are mean values ± SD of N = 3. ****P < 0.0001. Two-way ANOVA with Sidak’s multiple comparison test.
