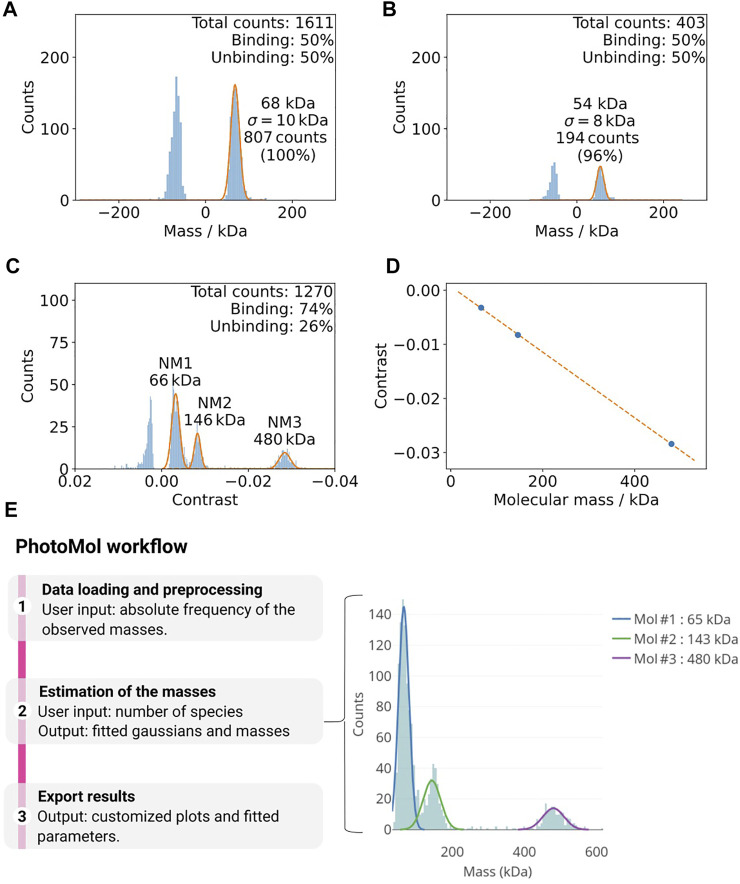
FIGURE 3.
(A,B) Example of how buffer impurities can negatively affect mass photometry measurements (Tris-HCl 100 mM, pH 8.5, 100 mM NaCl, 1 mM DTT). (A) The vacuum filtered buffer on the left shows a considerable amount of counts at ca. 68 kDa. (B) An additional filter step (right) drastically decreases this background. (C,D) Calibration of mass photometer. (C) Histogram of the mass distributions used for the calibration of the mass photometer using the native marker in PBS buffer (pH 7.4). The Gaussian fittings for the different populations are shown in orange. (D) The contrast values from (A) and the known masses of the calibration standards are used for a calibration line (maximum error here 0.3%). (E)The PhotoMol pipeline consists of three steps. First, the user loads an input file that contains the frequency of the observed masses (or contrasts). Pre-processing is first performed by selecting a bin width and a window range to build the histogram. Second, the user defines the number of Gaussians (species) present in the distribution and a truncated multi-Gaussian fit is executed. Finally, publication-grade figures can be downloaded together with information about the fitted parameters.

