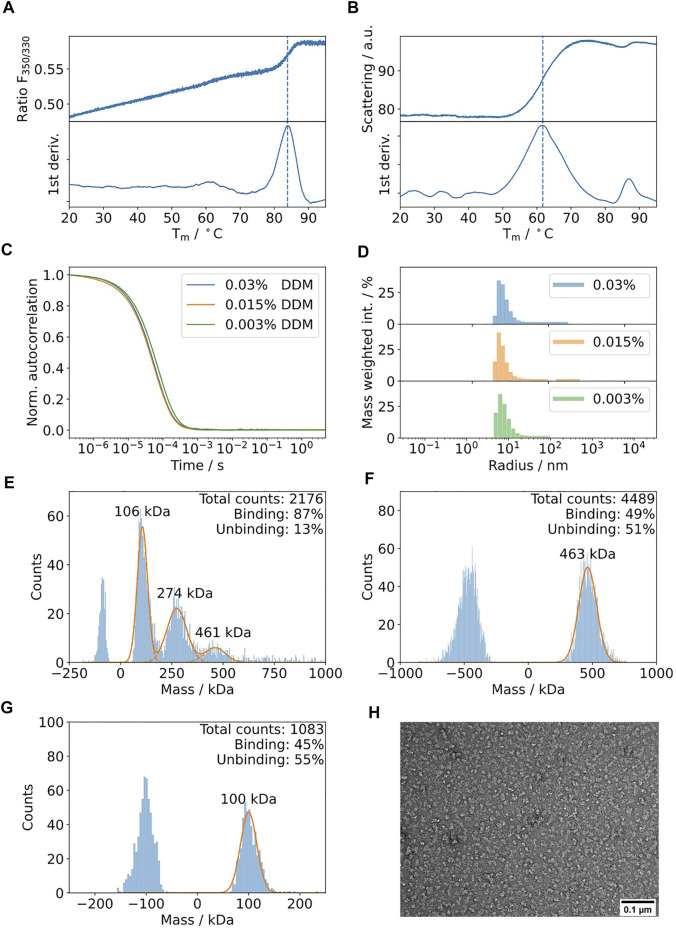
FIGURE 7.
Biophysical characterization of TolC in detergent DDM. (A) nDSF of 5 μM TolC in 0.03% DDM buffer with a heating rate of 1°C/min indicates a high thermal stability with a weak transition around 84°C. (B) The scattering curve acquired during the nDSF indicates aggregation at a lower temperature of 62°C. (C) The DLS autocorrelation curves suggest similar polydispersity and hydrodynamic radii for DDM concentrations in the range of 0.003 and 0.03%. (D) Mass weighted histograms for the curves displayed in Figure 7C (E). Mass photometry of 150 nM TolC in the presence of 0.003% DDM. Three bands are detectable at 106, 274, and 461 kDa. Control measurements at 0.03% (F) and 0.003% DDM (G) suggest that the bands at 106 and 461 kDa can be assigned to DDM. The band at 274 kDa can be assigned to the TolC-DDM complex (the theoretical mass of TolC is 162 kDa). (H) Negative staining electron micrographs of TolC at 0.015 mg/ml using 40000 x magnification on a Jeol 200 kV cryo-TEM using in-house carbon-coated grids.

