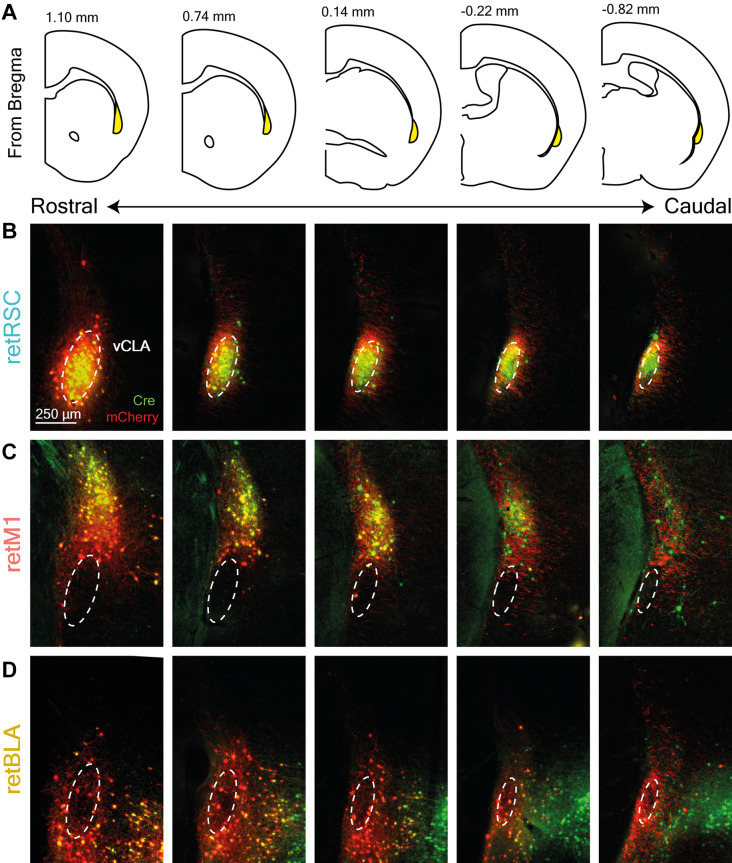
Figure 2.
Topological zones in the CLA are maintained throughout the rostral-caudal axis. (A) Diagram of coronal sections corresponding to CLA images shown in (B–D). The CLA is highlighted in yellow and the distance from the bregma is indicated at the top. (B–D) Examples of retrograde Cre (green) and conditional mCherry (red) expression across the entire rostral-caudal extent of the CLA (columns). Each row corresponds to a different initial target: (B) RSC-projecting (retRSC), (C) BLA-projecting (retBLA), and (D) M1-projecting (retM1). Dotted white ellipses demarcate the ventral CLA core (vCLA) based on parvalbumin staining (not shown).

