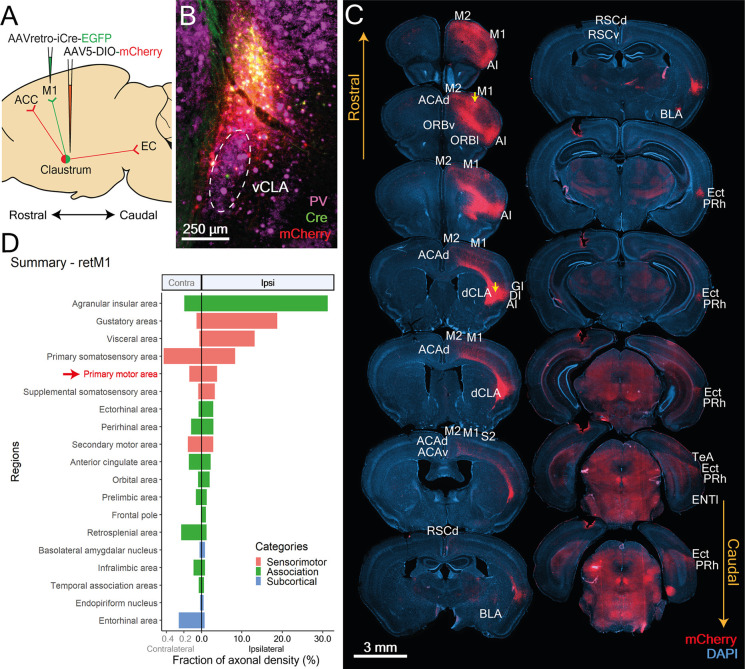
Figure 5.
CLA neurons projecting to M1 localize in the dorsal CLA and co-project to sensorimotor-related cortical regions. (A) Illustration of double virus injection strategy used to label CLA neurons projecting to the M1 and their axons. (B) CLA-specific expression of Cre and mCherry based on experiment shown in (A). vCLA core boundaries (white dotted ellipse) are demarcated based on parvalbumin (PV) antibody staining. (C) Mapping of axon collateral from M1-projecting CLA neurons. Raw images of mCherry expression against DAPI stained coronal sections. Yellow arrows denote viral injection sites. Regions receiving axons are labeled. M1, M2, Primary and secondary motor cortex; AI, Agranular insula; ACCd, Anterior cingulate cortex dorsal; ORBv, ORBl, Orbital cortex ventral, lateral; GI, DI, Granular, Dysgranular Insula; dCLA, dorsal claustrum; RSCd, vRSCv, Retrosplenial cortex dorsal, ventral; S2, Secondary somatosensory cortex; BLA, Basolateral amygdala; Ect, Ectorhinal cortex; Prh, Perirhinal cortex; TeA, Temporal association cortex; LEC, Lateral entorhinal cortex. (D) Mean fraction of axonal density for all innervated regions, sorted by labeling strength. Red arrow and text identifies retrograde Cre origin: M1. Agranular insula, gustatory, visceral, and primary somatosensory cortices had heavier innervation compared to M1. Colors represent region categories: Association—green; Sensorimotor—pink; and Subcortical—Blue. Note different ranges for contralateral and ipsilateral values.

