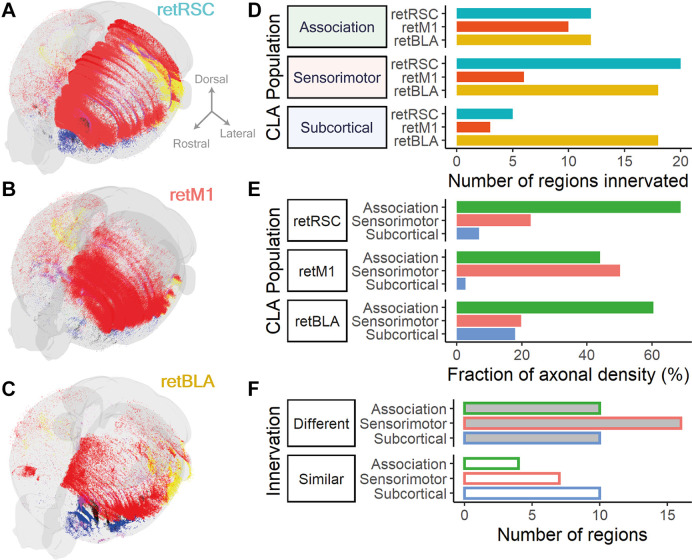
Figure 9.
CLA neurons projecting to RSC, BLA, and M1 form different projection distributions and differ most heavily in sensorimotor innervation. (A–C) 3D reconstruction of fiber densities as point clouds; colors represent different broad region categories: Cortex, red; Olfactory, blue; and Hippocampal formation, yellow. (A) From RSC-projecting CLA neurons (retRSC). (B) From M1-projecting CLA neurons (retM1). (C) From BLA-projecting CLA neurons (retBLA). (D) Fraction of axonal density from each CLA projection population split into association (green), sensorimotor (red), and subcortical (blue) categories.The distribution of axonal densities across the different categories differed between the three CLA populations. (E) Number of regions innervated by each CLA projection population grouped by broad region categories: Association, sensorimotor and subcortical. Only regions with mean axonal density >0.002 of the total were considered to be innervated. Colors represent different CLA populations: retRSC in teal, retM1 in orange, retBLA in yellow. The number of innervated regions was similar for association cortices between all three CLA populations but differed for the sensorimotor and subcortical categories. (F) The number of regions in each broad region category that had different (top, shaded bar) or similar (bottom, open bar) innervation by all three CLA populations. The difference in innervation was determined by statistical testing using ANOVA to compare axonal densities from each CLA neuron population to each innervated brain region. Colored border represents different broad region categories: Association in green, sensorimotor in red, and subcortical in blue. The number of regions that had different innervation between CLA populations was higher than the number of regions that had similar innervation for association and sensorimotor cortices, but were equal in number for the subcortical category.

