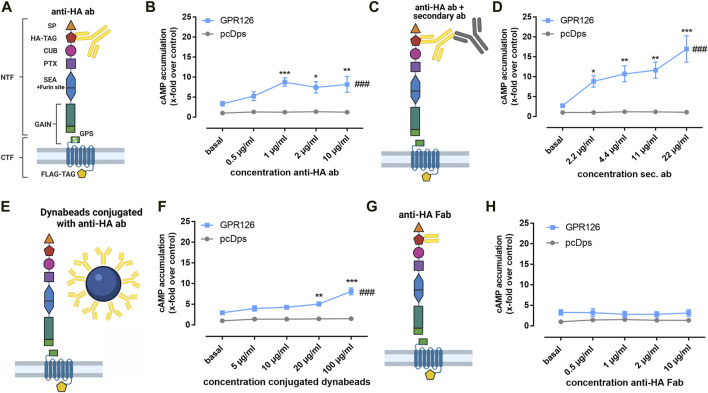
FIGURE 1.
Antibodies against the N terminus activate GPR126. (A) Schematic setup for the anti–HA antibody (anti-HA ab) stimulation of full-length WT GPR126 in cAMP accumulation assays. The N terminus contains the signal peptide (SP, orange triangle), a complement C1r/C1s-Uegf-BMP1 domain (CUB, magenta oval), a pentraxin domain (PTX, purple square), and the sperm protein, enterokinase and agrin (SEA) domain (blue hexagon), including the furin site. The highly conserved GAIN domain (green rectangle) contains the GPS, which is followed by the Stachel sequence (S). In our receptor constructs, we inserted an N-terminal hemagglutinin tag (HA-TAG, red pentagon) immediately distal to the signal peptide and a C-terminal Flag tag (FLAG-TAG, yellow pentagon) right before the stop codon. (B). Different concentrations of anti–HA antibody (0.5 µg/ml ≙ 3.3 µM; 1 µg/ml ≙ 6.67 µM; 2 µg/ml ≙ 13.34 µM; 10 µg/ml ≙ 66.7 µM) were used to treat vector control (pcDps) and GPR126-transfected COS-7 cells (effect of construct p = 0.0410, effect of concentration p < 0.0001, interaction construct × concentration p = 0.0506; two-way ANOVA). Basal cAMP level in pcDps transfected cells: 8.9 ± 0.8 nM/well. (C,D) Amplification of the cAMP signal of GPR126 with 1 µg/ml of anti–HA antibody and subsequent incubation with different concentrations of secondary antibody (2.2 µg/ml ≙ 14.7 µM; 4.4 µg/ml ≙ 29.3 µM; 11 µg/ml ≙ 73.3 µM; 22 µg/ml ≙ 146.7 µM) on vector control and GPR126-transfected COS-7 cells (effect of construct p = 0.0104, effect of concentration p < 0.0001, interaction construct × concentration p = 0.0072; two-way ANOVA). Basal cAMP level in pcDps transfected cells: 4.2 ± 1.0 nM/well. (E,F) Paramagnetic Dynabeads® were conjugated with anti–HA ab and used in different concentrations for stimulation of vector control and GPR126-transfected COS-7 cells (effect of construct p = 0.0001, effect of concentration p < 0.0001, interaction construct × concentration p < 0.0001; two-way ANOVA). An empty vector (pcDps) served as a negative control. Basal cAMP level in pcDps transfected cells: 5.8 ± 0.4 nM/well. (G,H) cAMP accumulation upon incubation with indicated concentrations of Fab fragment (0.5 µg/ml ≙ 10 μM; 1 µg/ml ≙ 20 μM; 2 µg/ml ≙ 40 μM; 10 µg/ml ≙ 200 µM) on vector control and GPR126-transfected COS-7 cells (effect of construct p < 0.0001, effect of concentration p = 0.9920, interaction construct x concentration p = 0.9032; two-way ANOVA). Basal cAMP level in pcDps transfected cells: 7.7 ± 1.2 nM/well. All data are given as means ± SEM of three–five independent experiments each performed in triplicates. Statistics were performed by applying a two-way ANOVA followed by Dunnett’s post hoc analysis; *p < 0.05; **p < 0.01; ***p < 0.001. All significances given as stars (*) above individual points in the graphs show the result of the post hoc analysis, while # indicates significant concentration-dependent effects (### p < 0.001). Corresponding raw data can be found in the repository. Schematic images were created with BioRender.com.

