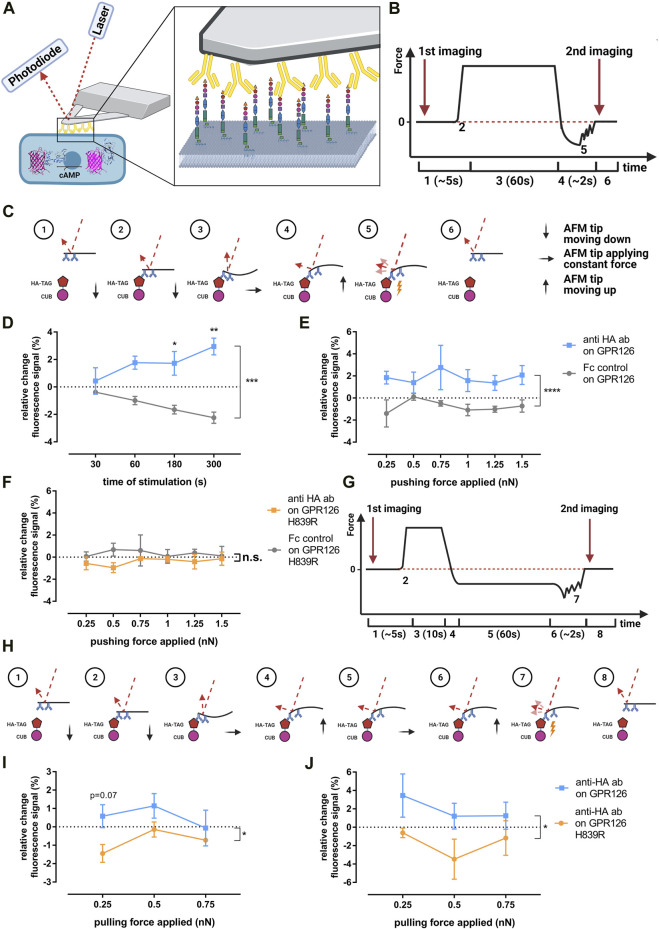
FIGURE 3.
Evaluating potential mechano-activation of GPR126 via anti-HA antibodies. (A) Schematic AFM experiment setup with a coated tipless cantilever pressing on a cell co-transfected with GPR126 and the Pink Flamindo cAMP sensor. (B,C) Course of the AFM cantilever deflection during the pushing experiments and the forces applied to the receptor and corresponding laser deflection: (Monk et al., 2009) cantilever approaches cell; (Monk et al., 2011) point of contact between the cantilever and cell; (Mogha et al., 2013) constant pressure being applied to the cell; (Ravenscroft et al., 2015) cantilever is retracted from the cell; (Mogha et al., 2016) rupture of cantilever bindings; (Sun et al., 2020) all bindings are ruptured and the cantilever is back in its starting position. (D) Changes in Pink Flamindo fluorescence intensity after applying a pushing force of 1 nN on the WT receptor at different time points (effect of time p = 0.775, effect of coating p = 0.0002, interaction time × coating p = 0.065; two-way ANOVA). (E,F) Changes in Pink Flamindo fluorescence intensity after applying indicated pushing forces for 60s on the WT receptor (E) (effect of force applied p = 0.878, effect of coating p < 0.001, interaction force × coating p = 0.882; two-way ANOVA) and the H839R mutant (F) (effect of force applied p = 0.981, effect of coating p = 0.0867, interaction force × coating p = 0.924; two-way ANOVA). (G,H) Course of the AFM cantilever deflection during the force clamp experiments and the forces applied to the receptor and corresponding laser deflection: (Monk et al., 2009) cantilever approaches cell; (Monk et al., 2011) point of contact between cantilever and cell; (Mogha et al., 2013) initial pressure being applied to allow binding between cantilever and cell; (Ravenscroft et al., 2015) cantilever is retracted from the cell until the desired pulling force is applied; (Mogha et al., 2016) constant pulling force is applied; (Sun et al., 2020) cantilever is retracted from the cell completely; (Suchý et al., 2020) rupture of cantilever bindings; (Karner et al., 2015), all bindings are ruptured and the cantilever is back in its starting position. Changes in Pink Flamindo fluorescence intensity after applying indicated pulling forces over (I) 60s (effect of force applied p = 0.297, effect of receptor variant p = 0.0135, interaction force × receptor variant p = 0.497; two-way ANOVA) and (J) 300s (effect of force applied p = 0.405, effect of receptor variant p = 0.0386, interaction force × receptor variant p = 0.804; two-way ANOVA). Data are given as means ± SEM of three-five different experiments each measuring three individual cells for each force and time. Statistics were performed as two-way ANOVA followed by Tukey’s post hoc analysis; *p < 0.05; **p < 0.01. All significances given as stars (*) above individual points in the graphs show the result of the post hoc analysis, while # indicates significant coating-dependent (D,E) or receptor-variant-dependent (I,J) effects (# p < 0.05; ### p < 0.001). Corresponding raw data can be found in the repository. Schematic images (A–C,G–H) were created with BioRender.com. The Pink Flamindo depiction in A was taken from (Harada et al., 2017).

