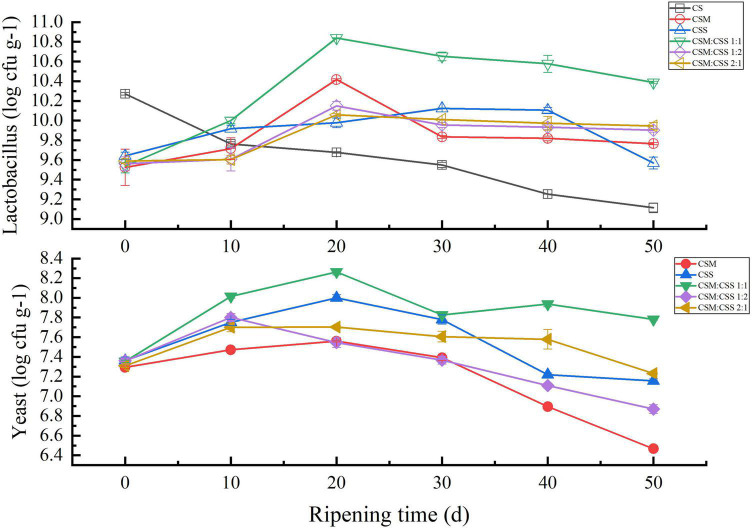
FIGURE 1.
Comparative analysis of the microorganism content of the cheeses. CS, CSM, CSS, CSM:CSS 1:1, CSM:CSS 1:2 and CSM:CSS 2:1 represent cheeses fermented using the commercial starter (Control group), K. marxianus B13–5, S. cerevisiae DL6–20, K. marxianus B13–5: S. cerevisiae DL6–20 1:1, K. marxianus B13–5: S. cerevisiae DL6–20 1:2, and K. marxianus B13–5: S. cerevisiae DL6–20 2:1. Error bars indicate standard deviations.

