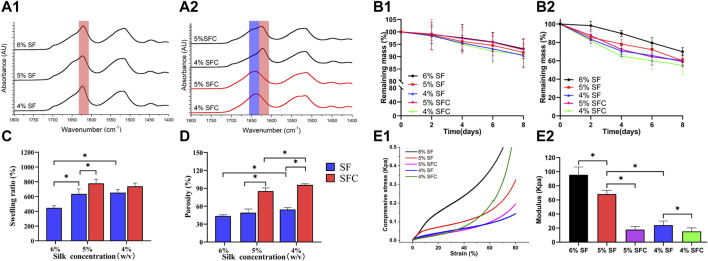
FIGURE 2.
Physical performance of SF and SFC scaffolds at concentrations of 4, 5, and 6% (w/v). FTIR spectra of SF (A1) and SFC (A2) scaffolds at different concentrations (w/v) before (red line) and after (dark line) autoclaving. Time-dependent weight change of SF and SFC scaffolds in a PBS buffer (B1) and protease XIV solution (B2) are shown. Adding collagen I increased the swelling ratio (C) and porosity (D). A compressive stress–strain curve showing SF and SFC scaffolds in the hydrated state (E1) and the summary of the compressive modulus for SF and SFC scaffolds (E2). (*p < 0.05).

