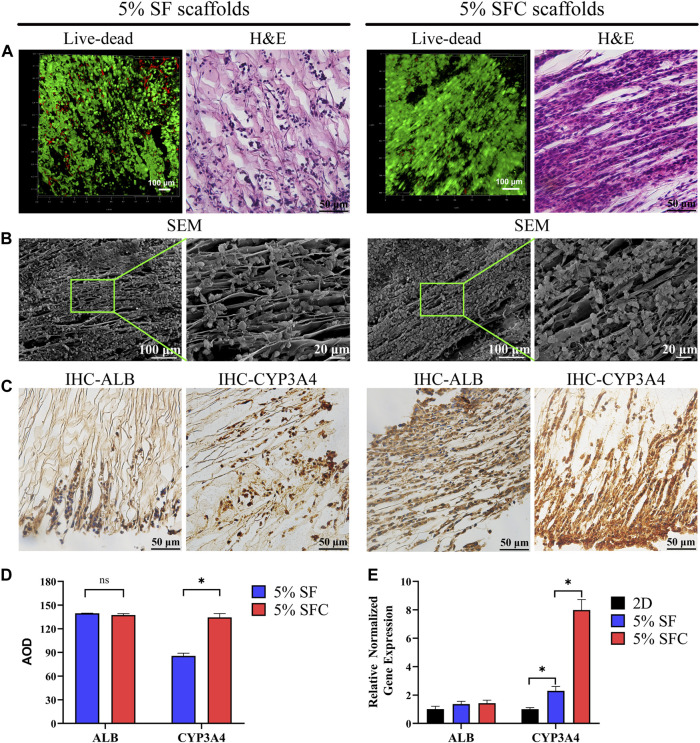
FIGURE 3.
Biocompatibility of 5% composite SFC scaffolds (w/v). The viability staining and H&E staining of cells in both scaffolds (A). SEM images (B) showing the cell growth pattern on the surface of both scaffolds. IHC detection (C) of ALB and CYP3A4 expression of C3A cells in both scaffolds. Quantitative analysis of IHC staining (D) and functional gene expression of C3A cells in both scaffolds (E). (*p < 0.05).

