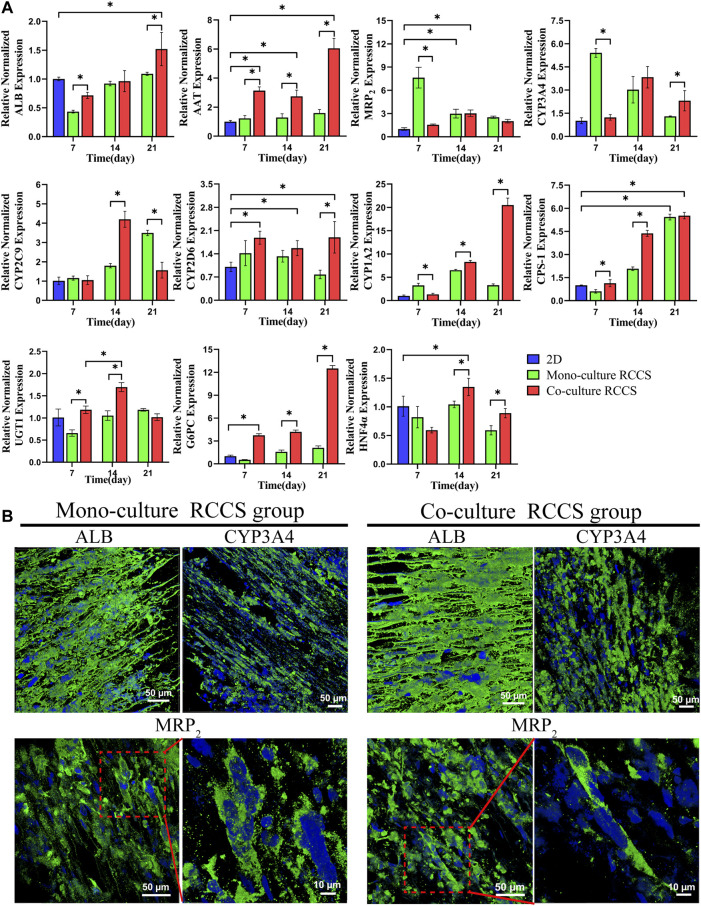
FIGURE 7.
Functional gene and protein expression in different culture conditions using RT-qPCR (A) and IF staining (B). Higher functional gene expression was found in the 3D co-cultures than in the 2D cultures and 3D monocultures (A). iHepLPC-Heps in both groups expressed ALB, CYP3A4, and MRP2 after 14 days of culture (B). (*p < 0.05).

